Interactivity (8 min)
Completion requirements
01 Getting Started
This tutorial covers chart and graph interactivity options.
02 Settings
To navigate to the settings menu:
1. Click the element.
2. Select the gear icon from the element menu. The element settings menu opens.

1. Click the element.
2. Select the gear icon from the element menu. The element settings menu opens.
03 Legend
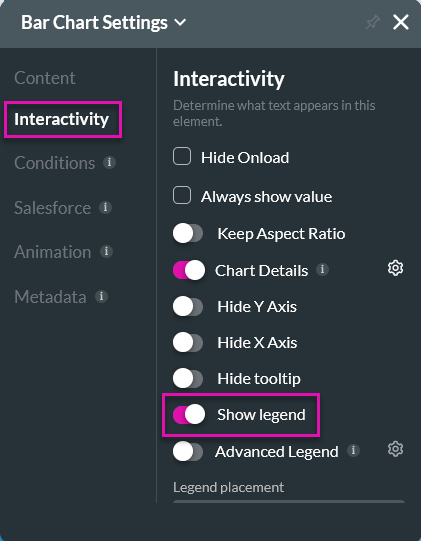
You can choose to show or hide the chart/graph legend. By default, the legend will be displayed.
1. Click the Interactivity tab in the element settings menu.
2. Use the Show Legend toggle switch to turn the legend on or off.
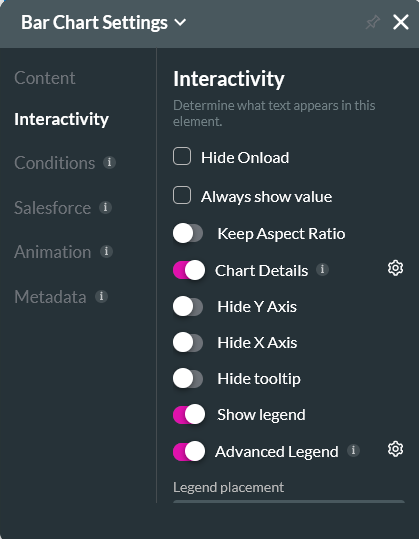
To configure advanced legend options:
1. Enable the Advanced Legend feature and click the gear icon.
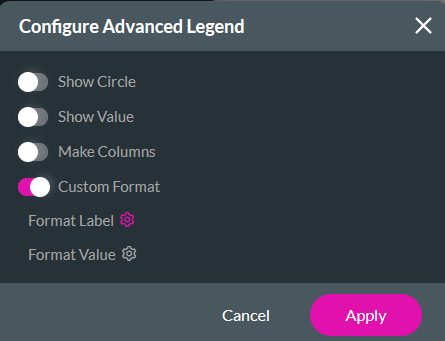
2. In the Configure Advanced Legend screen, you can choose to further format and customize your legend.
You can configure the placement of your legend using the options in the Interactivity tab.
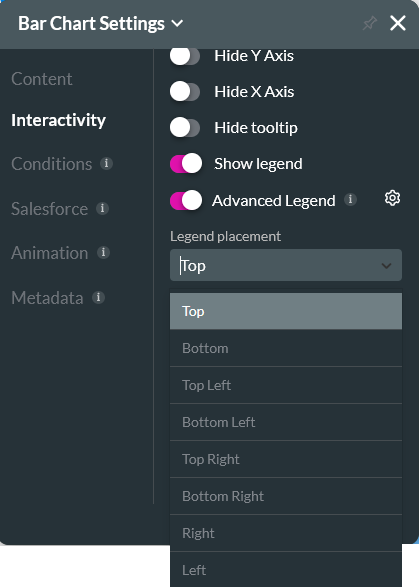
1. Click the Interactivity tab in the element settings menu.
2. Use the Show Legend toggle switch to turn the legend on or off.
To configure advanced legend options:
1. Enable the Advanced Legend feature and click the gear icon.
2. In the Configure Advanced Legend screen, you can choose to further format and customize your legend.
You can configure the placement of your legend using the options in the Interactivity tab.
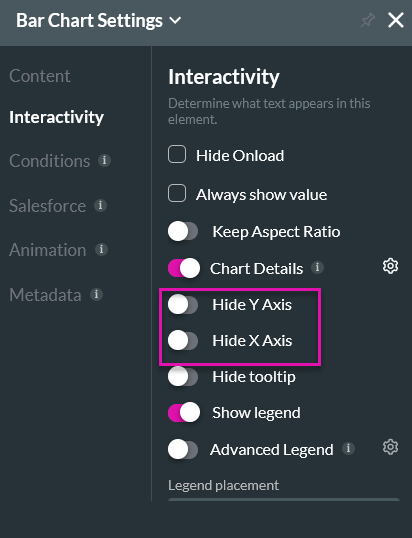
04 Axis
You can choose to show or hide your X and Y axes.
You can also configure how each axis displays, including the minimum, maximum, and increments.
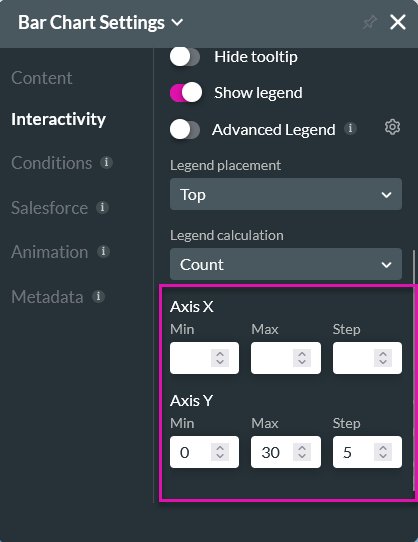
You can also configure how each axis displays, including the minimum, maximum, and increments.
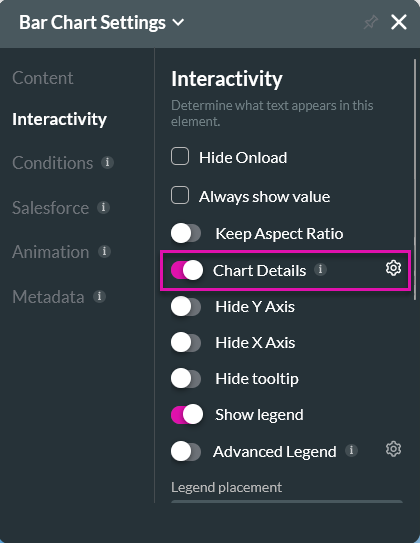
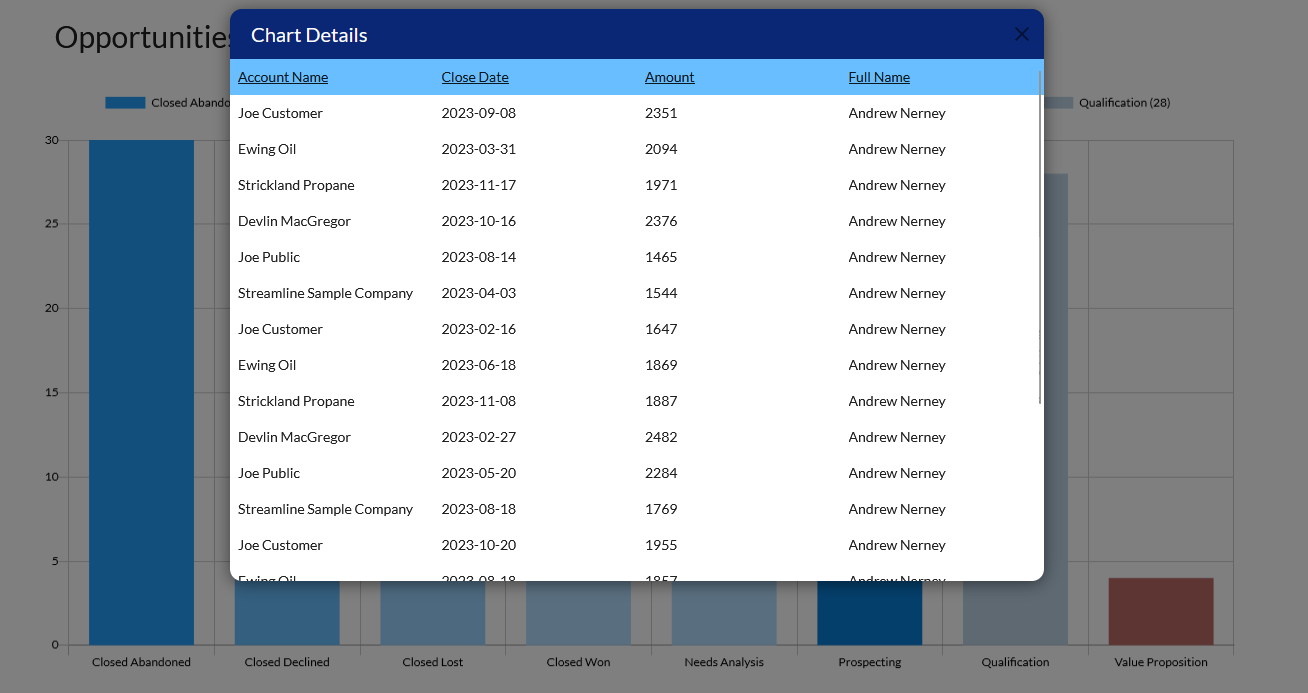
05 Chart Details
To allow users to open up details about the chart in a modal:
1. Enable the Chart Details function and click the gear icon.
2. In the Salesforce Configuration window, you can choose what details the user will see. These steps are similar to configuring your chart source, so ensure you review that lesson.
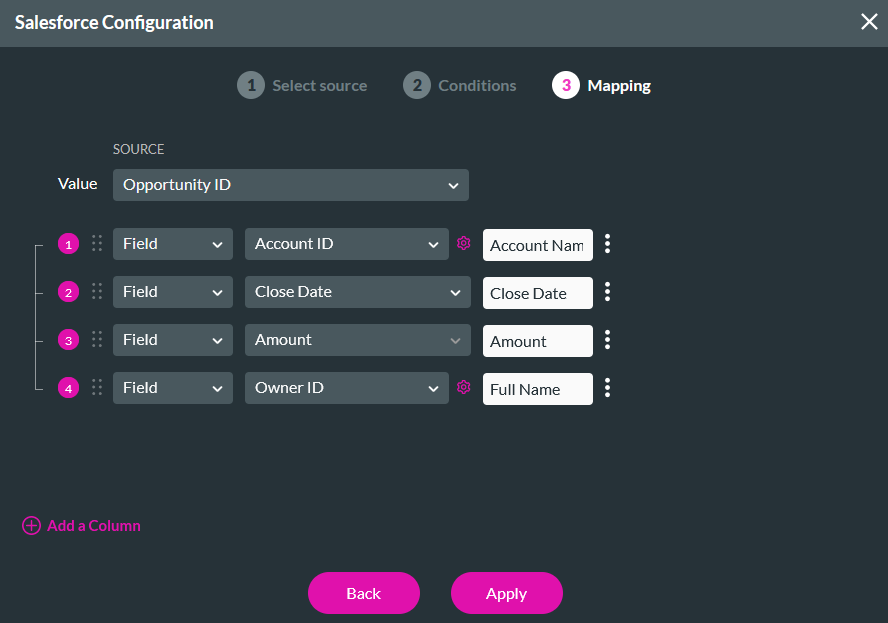
When the user clicks on one of the bars, a modal will open and display a detailed breakdown.
1. Enable the Chart Details function and click the gear icon.
2. In the Salesforce Configuration window, you can choose what details the user will see. These steps are similar to configuring your chart source, so ensure you review that lesson.
When the user clicks on one of the bars, a modal will open and display a detailed breakdown.
06 Custom Tooltip
Tooltips are only available on the doughnut chart and stacked line chart.
1. Enable the Custom Tooltip function and click the gear icon.
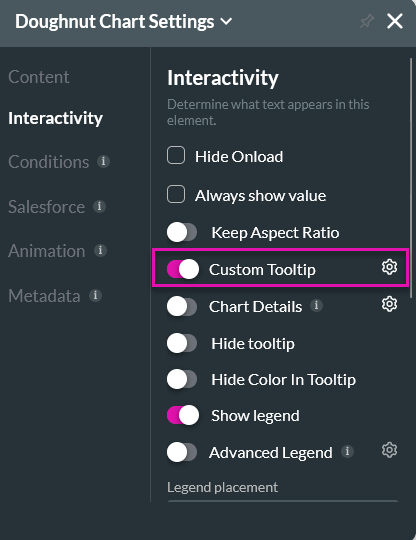
2. Using the Custom HTML options, you can choose the placement of your tooltip and configure the message to display.
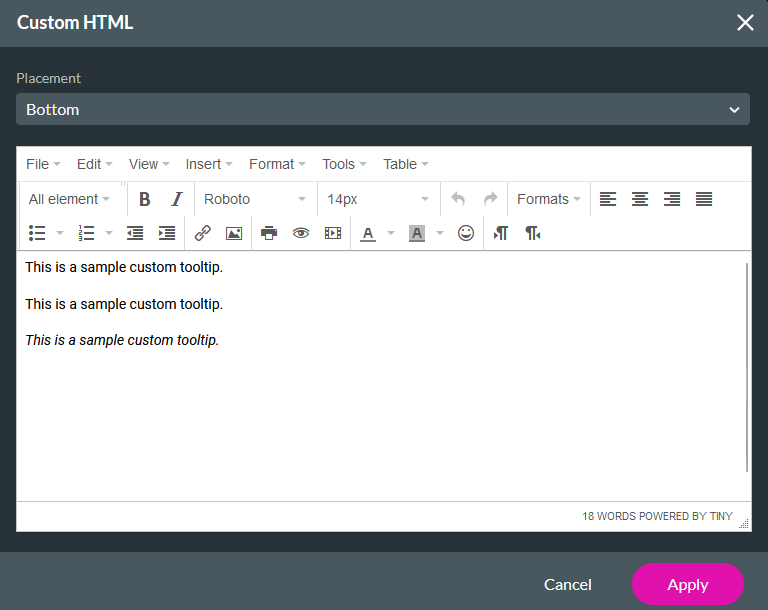
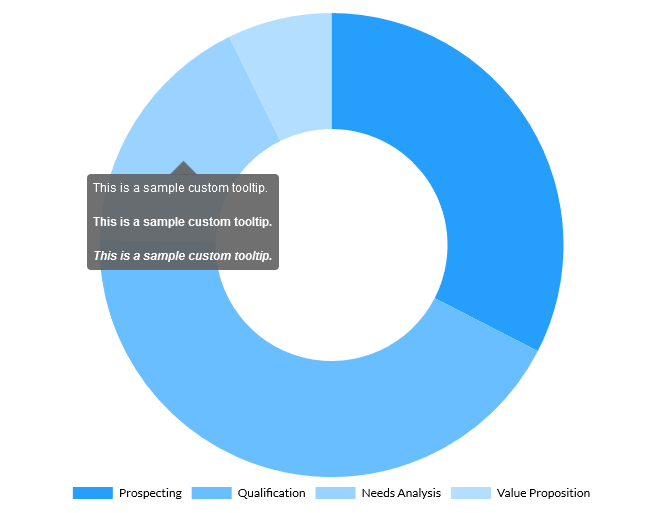
When the user hovers over your chart, the tooltip will display.
1. Enable the Custom Tooltip function and click the gear icon.
2. Using the Custom HTML options, you can choose the placement of your tooltip and configure the message to display.
When the user hovers over your chart, the tooltip will display.