Action Flow - Chart Interactivity Actions (5 min)
Completion requirements
01 Getting Started
This tutorial covers chart interactivity actions.
02 Axis Values
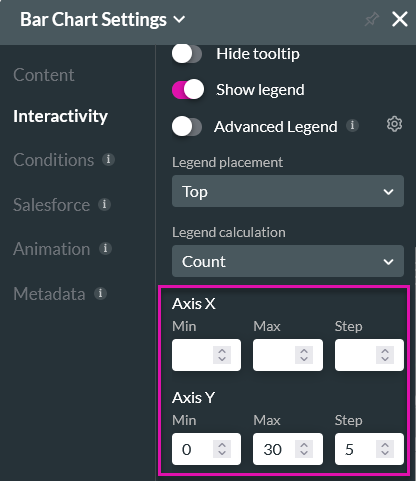
In the chart element menu under the Interactivity tab, you can configure the values for your axes.
03 Actions
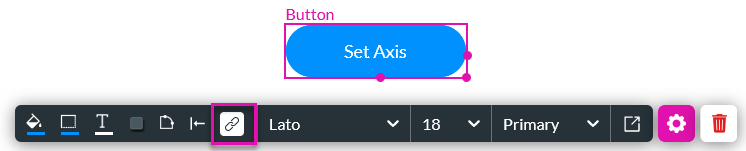
You need to insert an interactive element into your project to affect your graph - for example, a button.
1. Click the button interactivity icon. The On Click Action window opens.
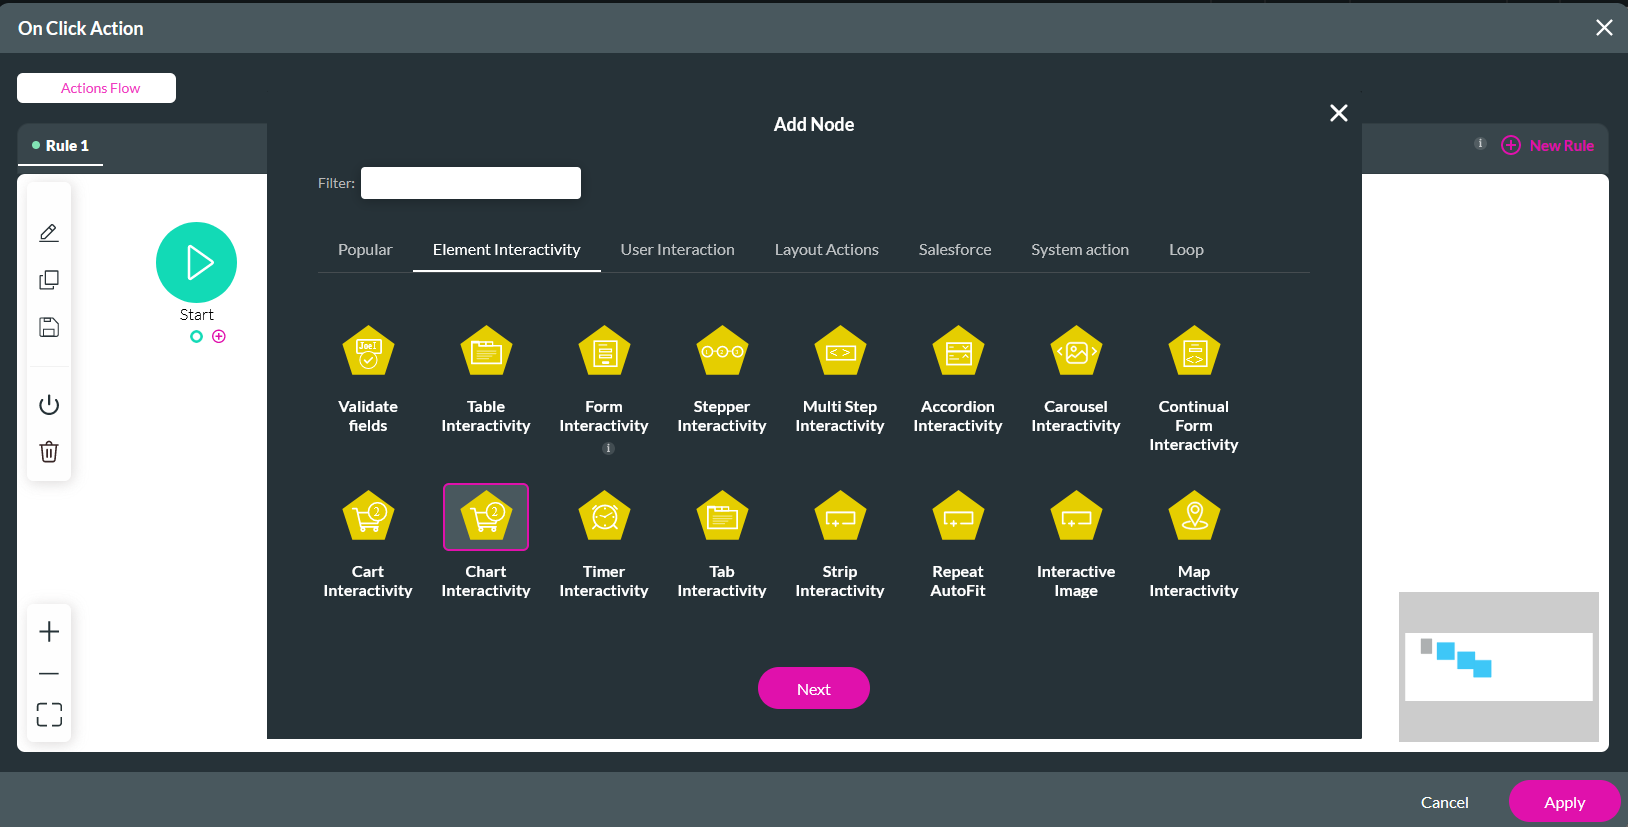
2. Select the Start + icon, choose Chart Interactivity as the node, and click Next.
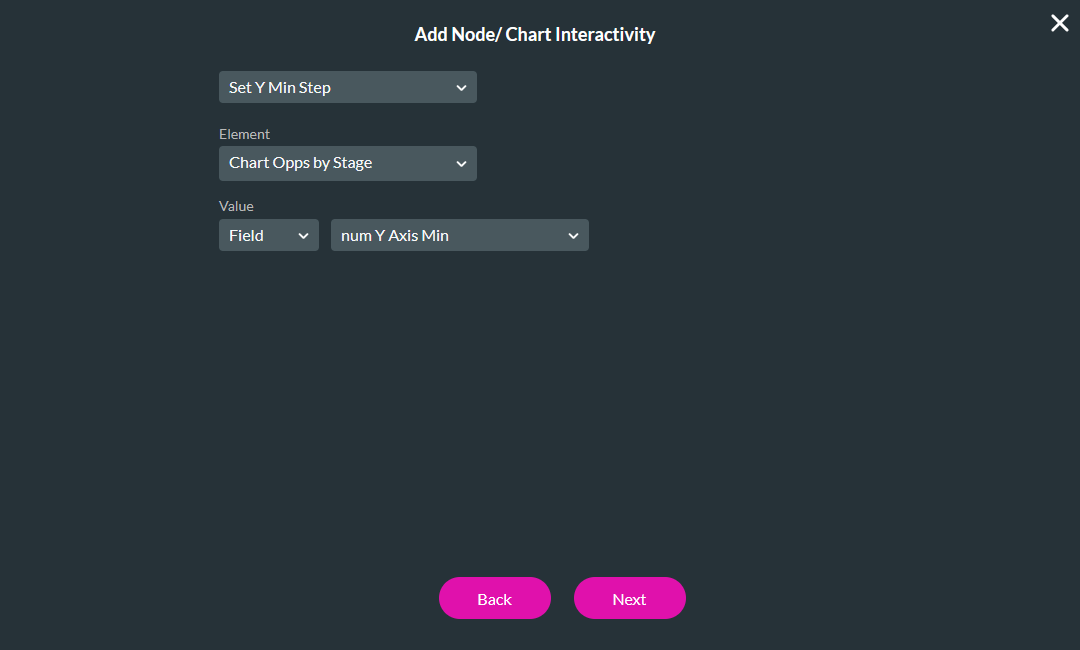
3. Use the dropdowns to select the value you want to affect, the chart, and the value that will be applied to the chart. Click Next.
4. Enter a Tag name and click Insert.
You can repeat the same steps for multiple elements on your chart.
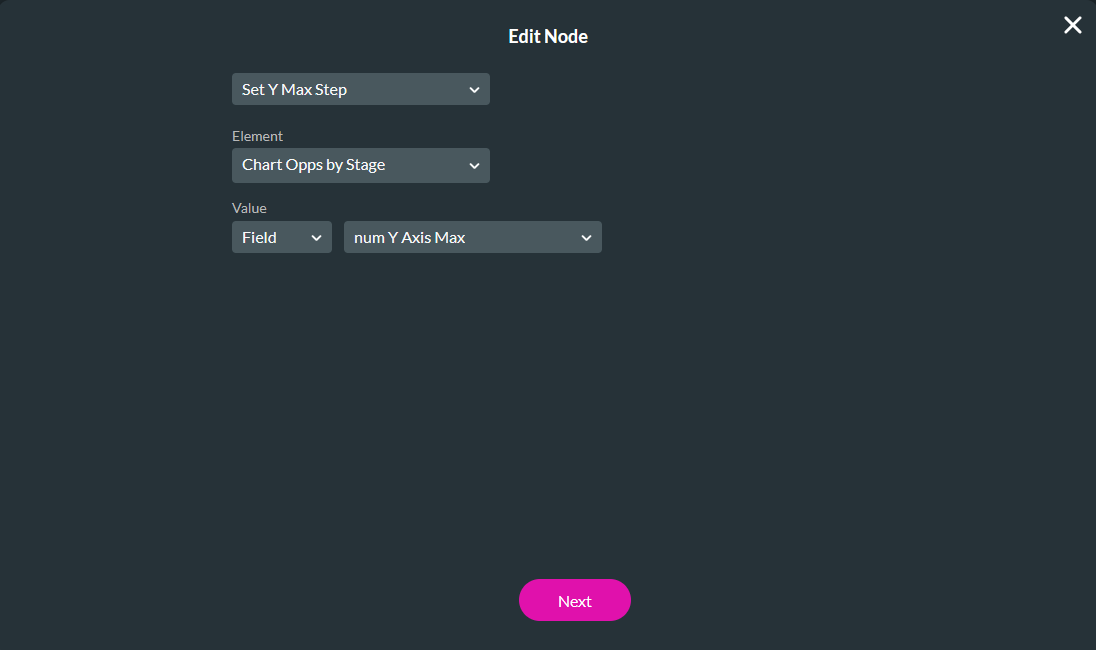
Below is the configuration for the Y-Axis Maximum.
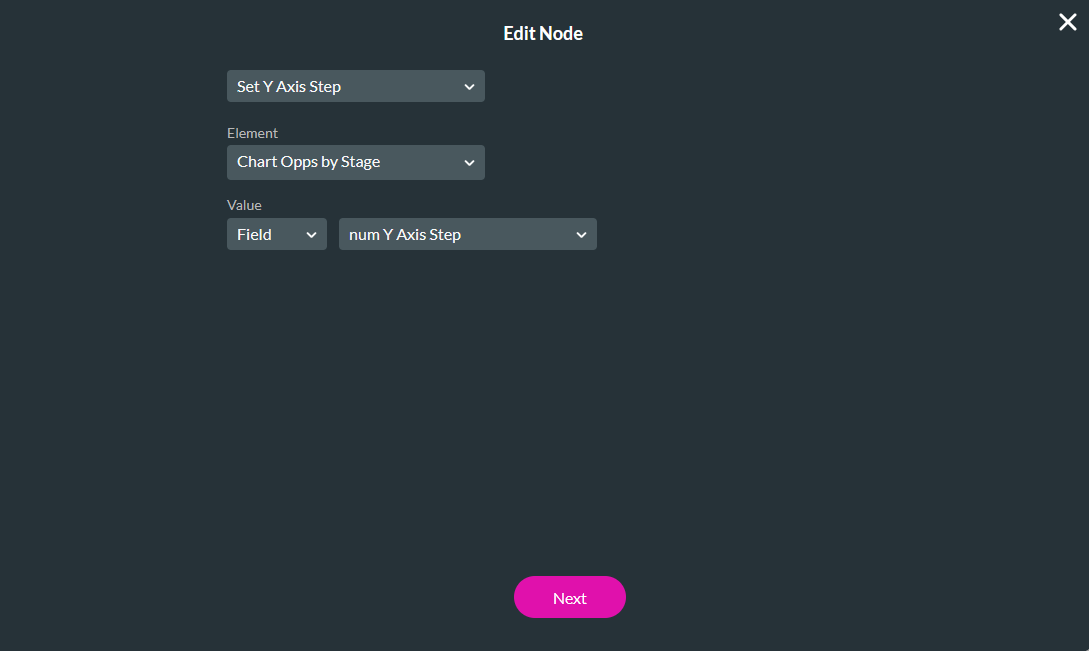
Below is the configuration for the Y-Axis Step.
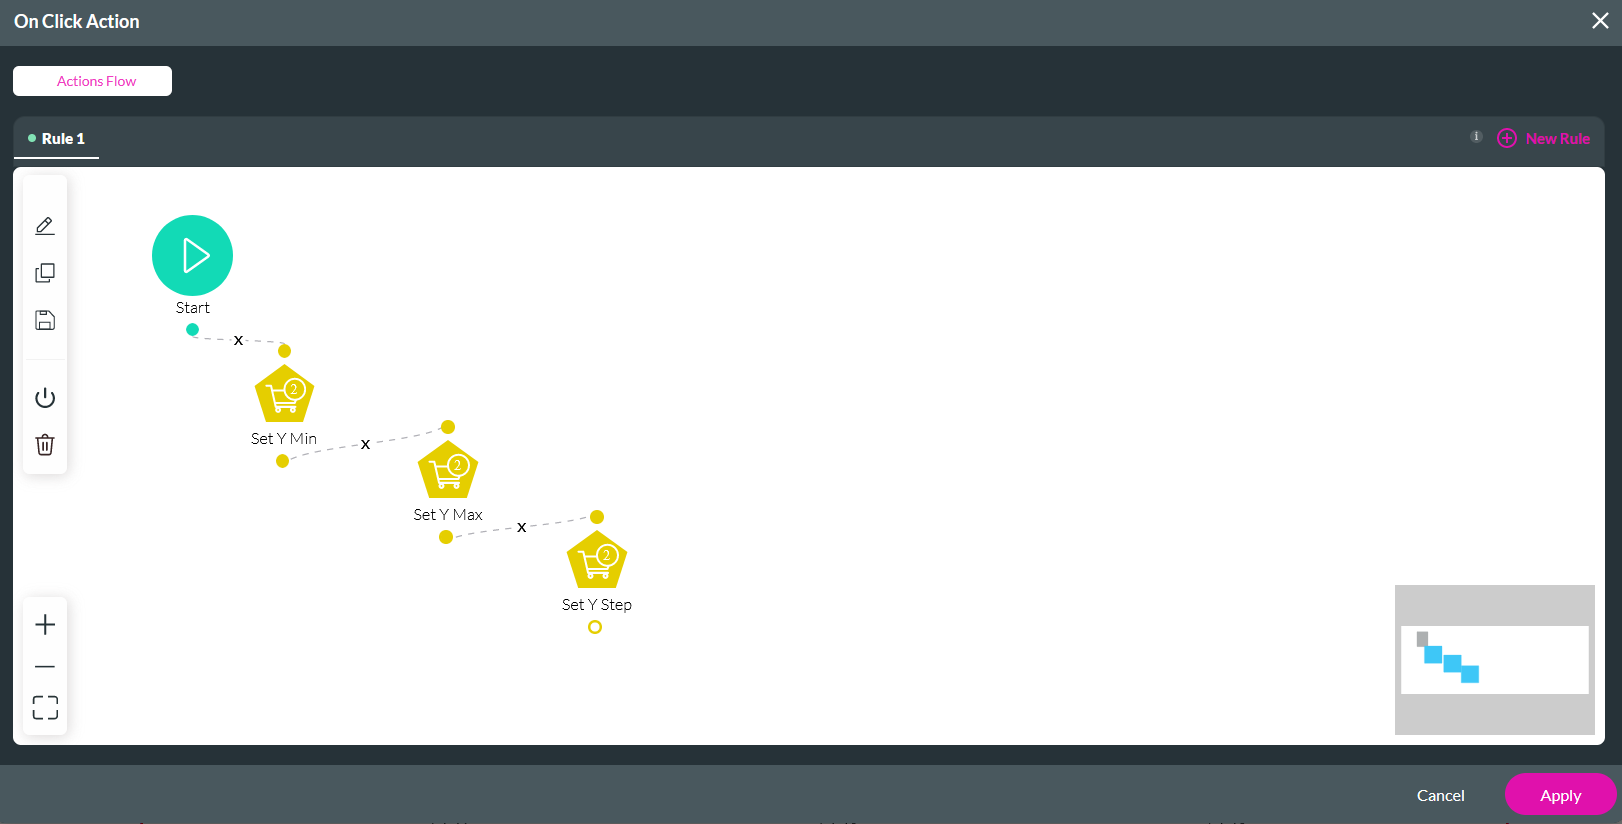
After completing all the configuration, the On Click Action window displays as follows:
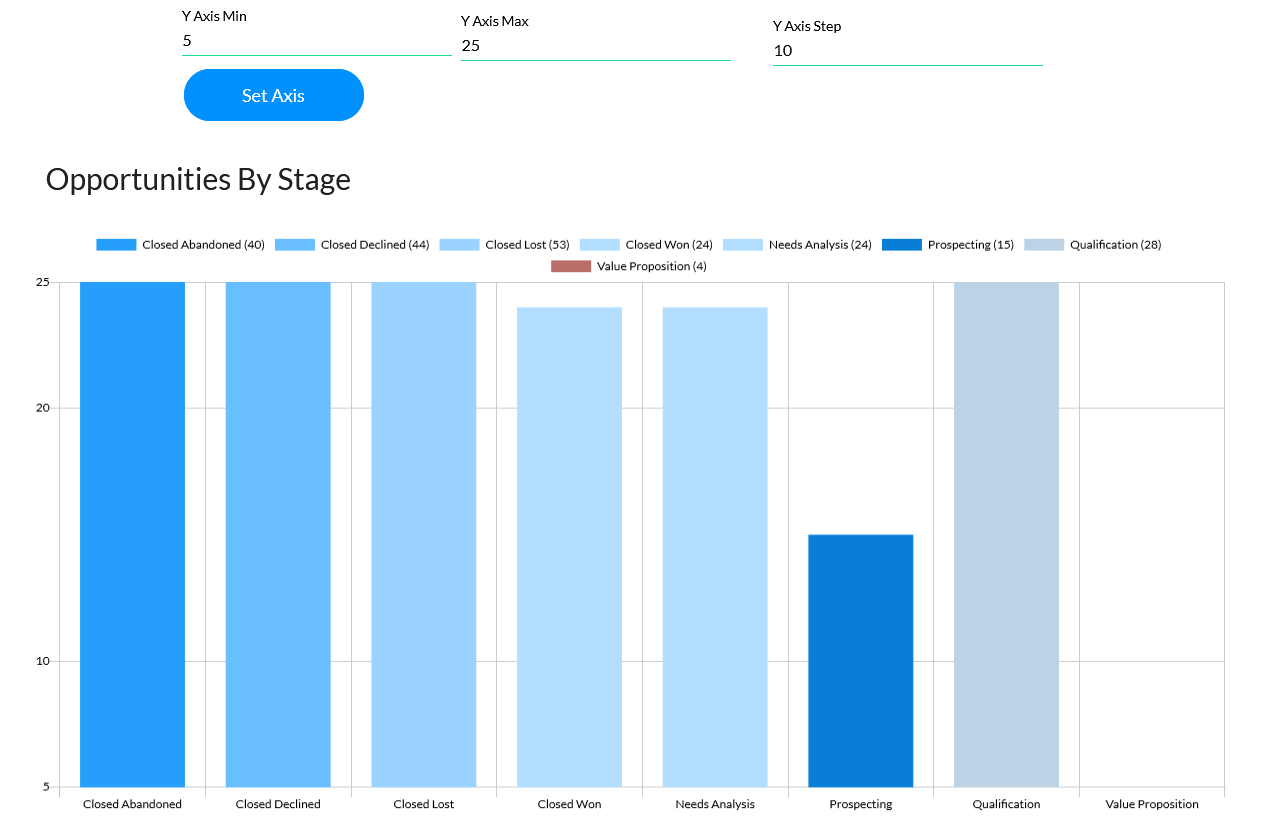
The user will be able to set the axis values and apply them by clicking the button.
1. Click the button interactivity icon. The On Click Action window opens.
2. Select the Start + icon, choose Chart Interactivity as the node, and click Next.
3. Use the dropdowns to select the value you want to affect, the chart, and the value that will be applied to the chart. Click Next.
4. Enter a Tag name and click Insert.
You can repeat the same steps for multiple elements on your chart.
Below is the configuration for the Y-Axis Maximum.
Below is the configuration for the Y-Axis Step.
After completing all the configuration, the On Click Action window displays as follows:
The user will be able to set the axis values and apply them by clicking the button.