Power Table Overview (16 min)
Completion requirements
01 Getting Started
In this tutorial, we shall explore one of Titan’s dynamic features, the Power Table.
02 Overview of a Power Table
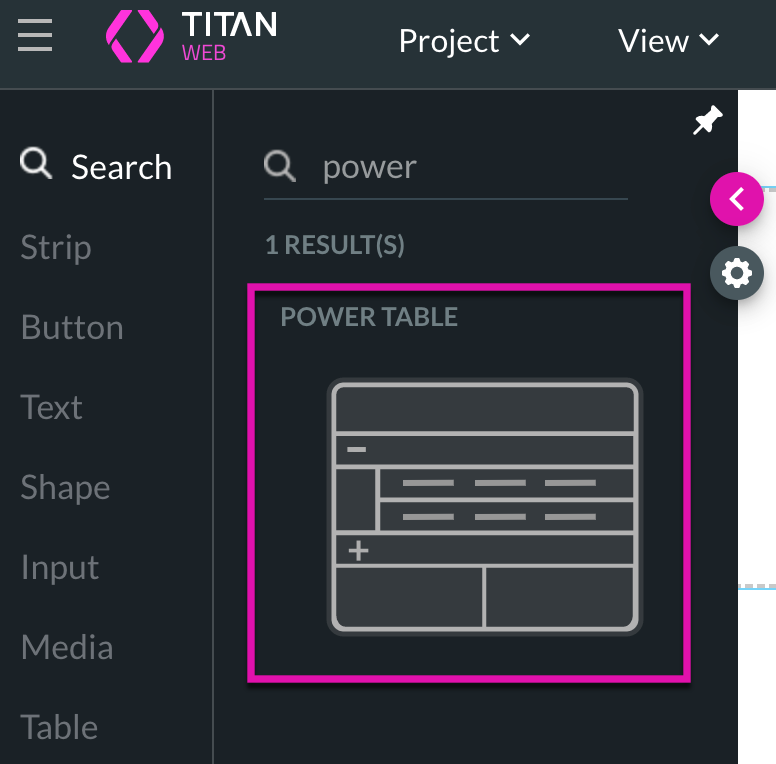
1. Search for a Power Table in your elements list and then drag it into a Titan Web project.

03 How to Configure a Power Table
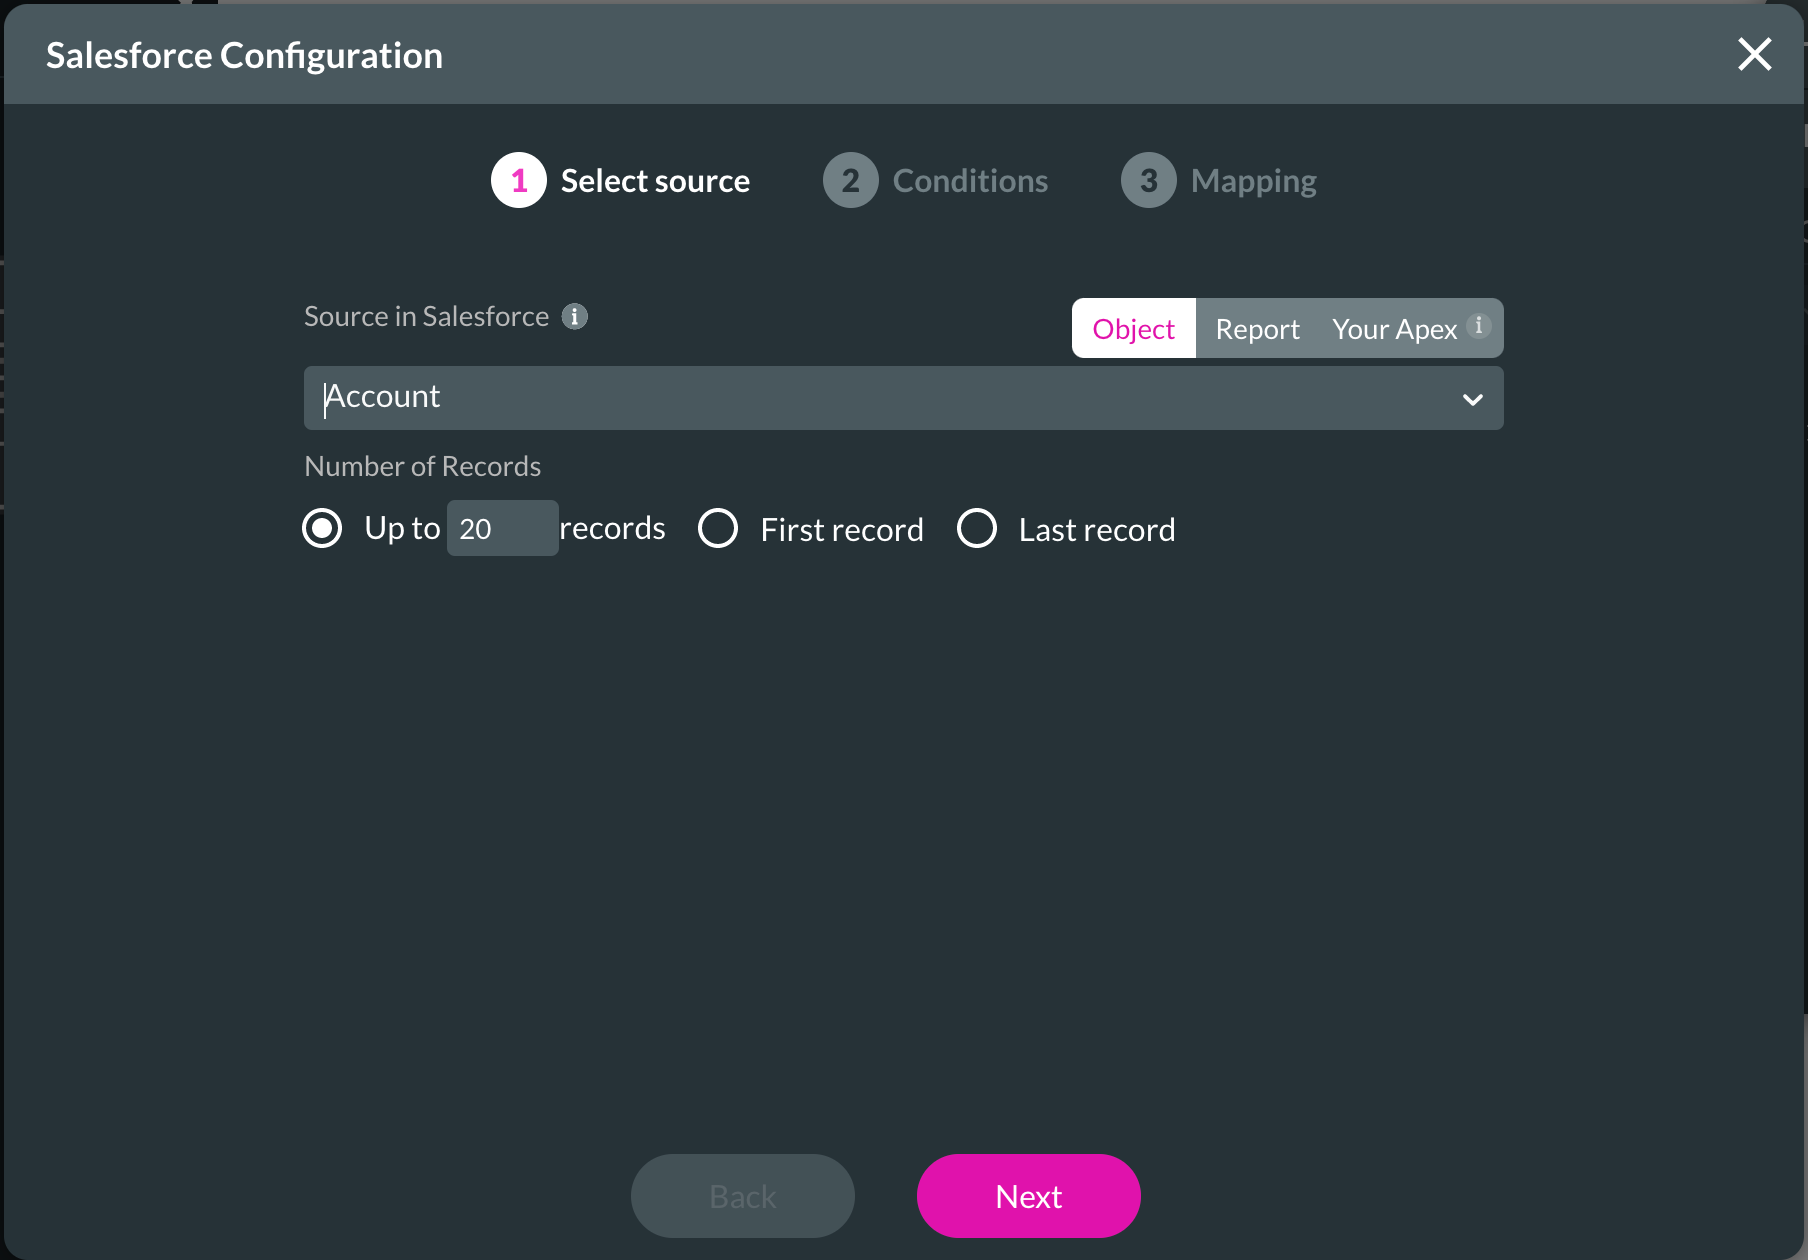
1. Select a source from which you want to bring your data and click the Next button.
Data can be pulled from a Salesforce object, a report, or an Apex. For this example, we have chosen Account as the source, but remember that you can bring data from any object you have in Salesforce, such as standard, custom, or managed package objects.
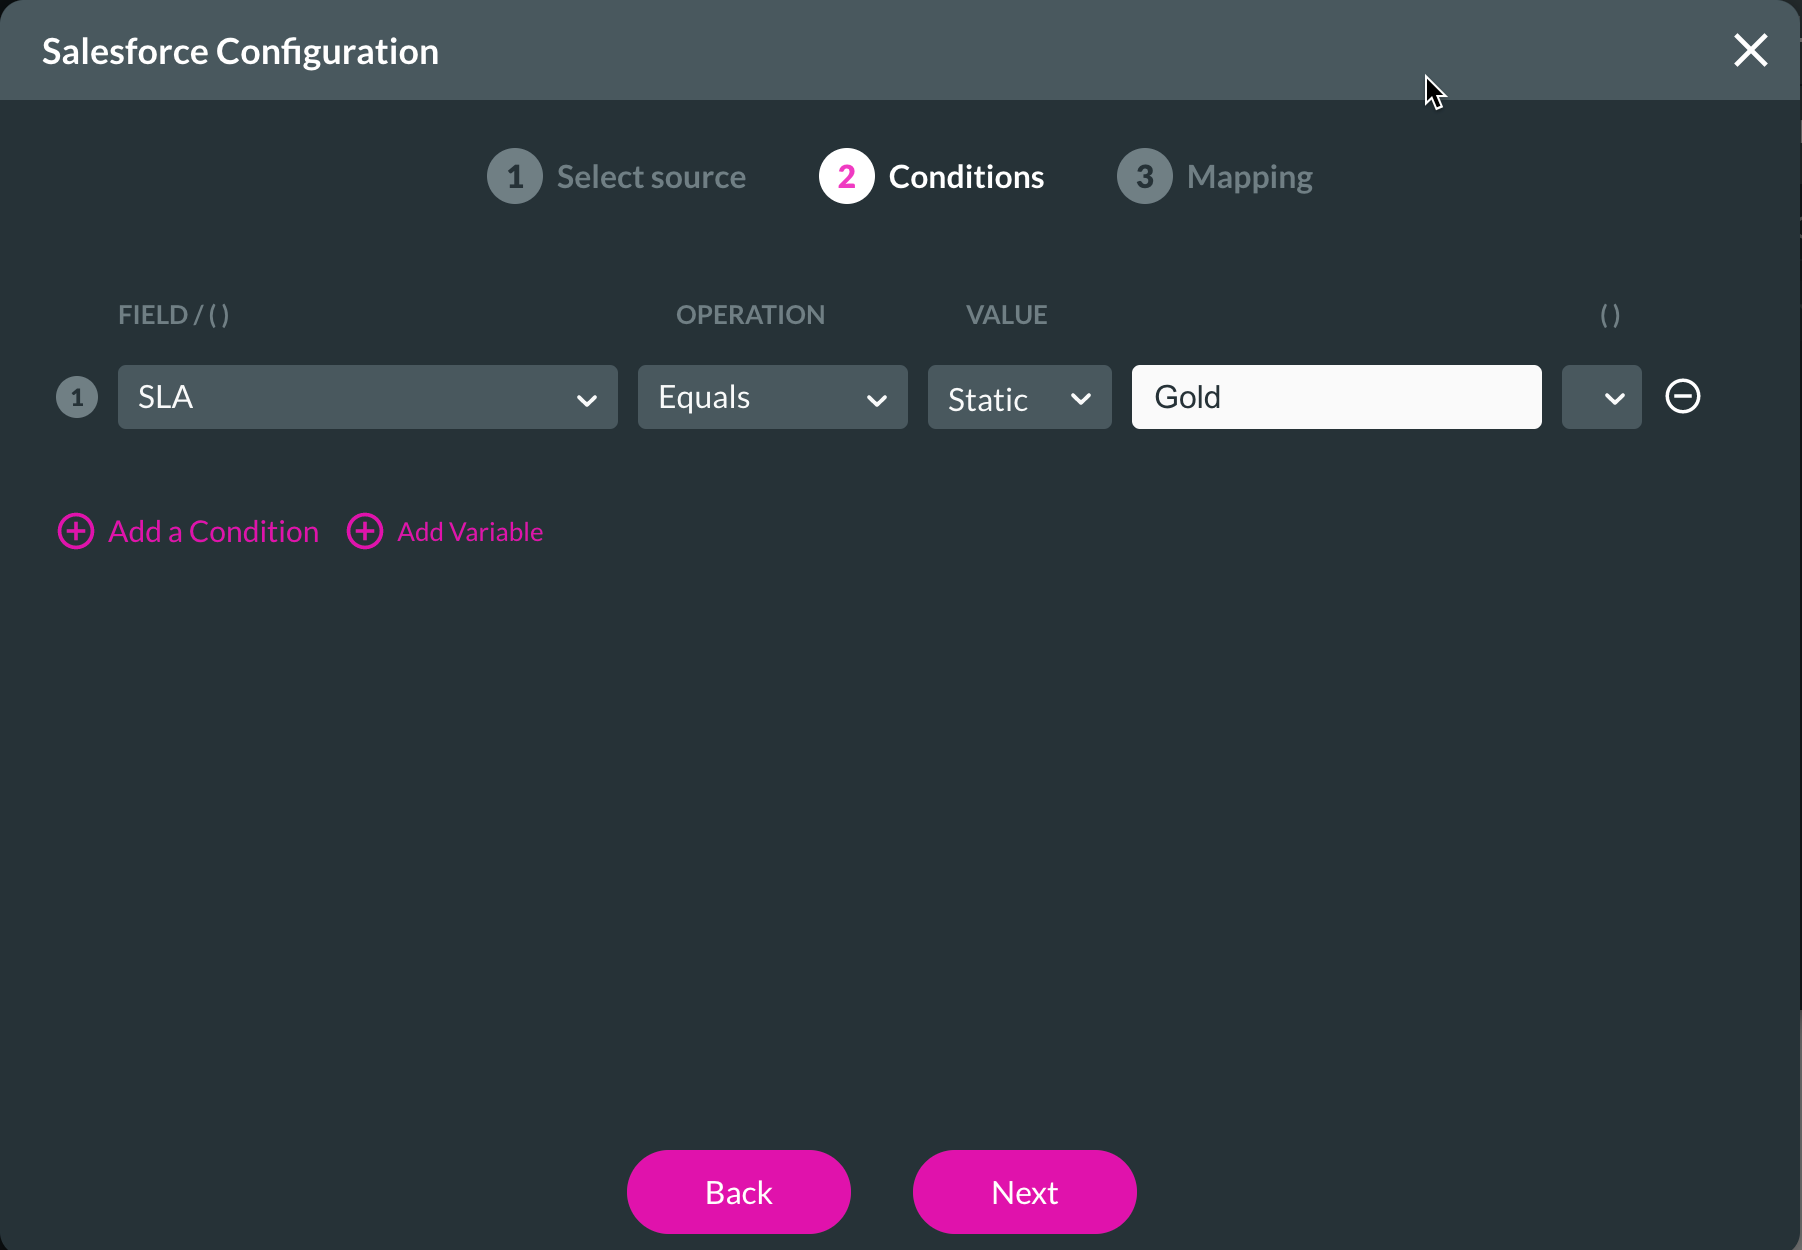
2. Add your condition to the Conditions section and click on the Next button. Our condition is set to SLA > Equals > Static > Gold.
Remember, you can do much more complex conditions with many rules and or statements with parentheses. Titan can also reference fields from a project instead of using static values, as shown in our tutorial.
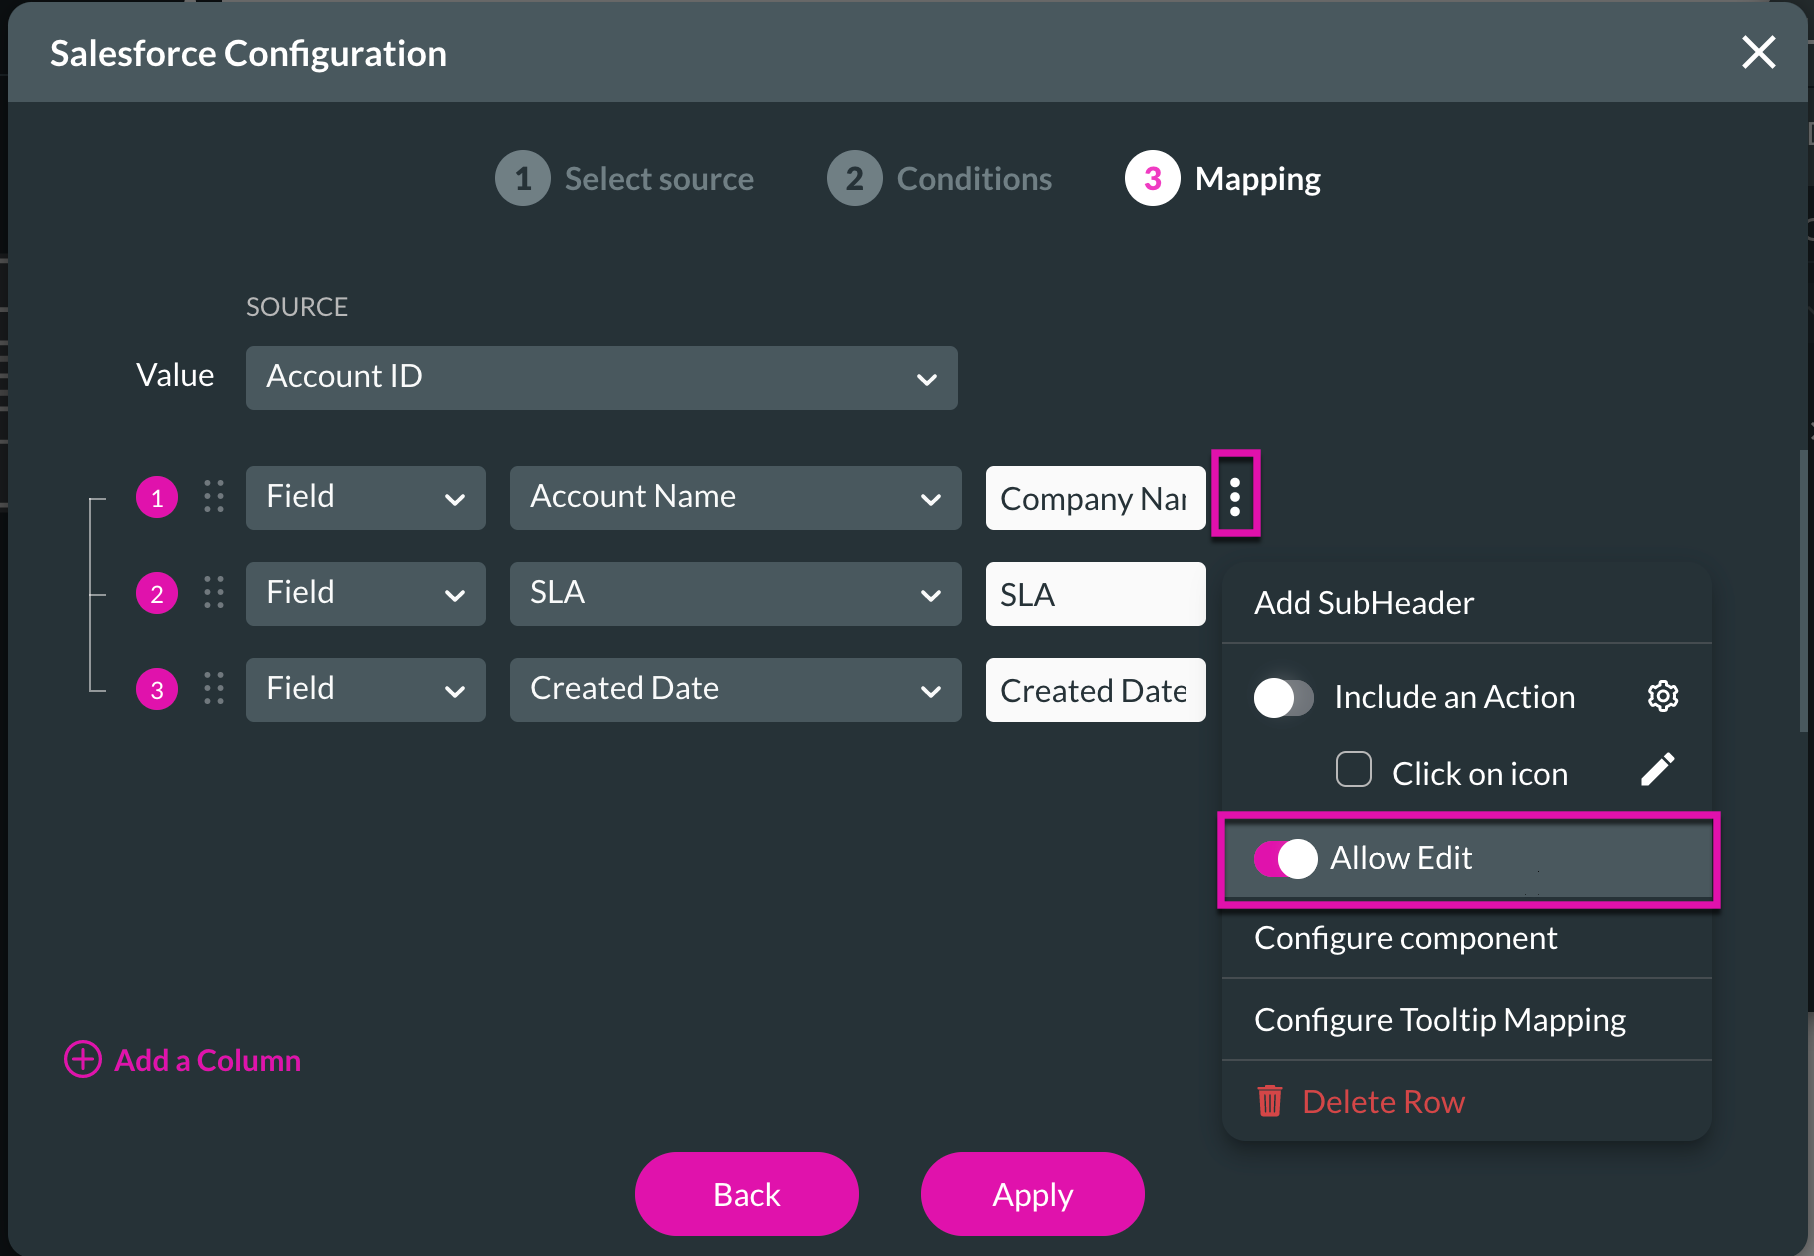
Mapping! Notice the Value field will usually be the Record ID for your object. This value sits behind the scenes for each row on your Power Table.
3. Add fields to your Power Table by clicking the + Add a Column button.
4. Add the Account Name, SLA, and Created Date to each field.
5. Rename the auto-filled labels so end users can view these column titles.

6. Allow end users to edit fields on the Power Table by clicking on the Kebab button and then turning on the Allow Edit toggle switch.
End users can now edit and make updates in Salesforce in real-time.
Data can be pulled from a Salesforce object, a report, or an Apex. For this example, we have chosen Account as the source, but remember that you can bring data from any object you have in Salesforce, such as standard, custom, or managed package objects.

2. Add your condition to the Conditions section and click on the Next button. Our condition is set to SLA > Equals > Static > Gold.
Remember, you can do much more complex conditions with many rules and or statements with parentheses. Titan can also reference fields from a project instead of using static values, as shown in our tutorial.

Mapping! Notice the Value field will usually be the Record ID for your object. This value sits behind the scenes for each row on your Power Table.
3. Add fields to your Power Table by clicking the + Add a Column button.
4. Add the Account Name, SLA, and Created Date to each field.
5. Rename the auto-filled labels so end users can view these column titles.

6. Allow end users to edit fields on the Power Table by clicking on the Kebab button and then turning on the Allow Edit toggle switch.
End users can now edit and make updates in Salesforce in real-time.

04 The Different types of fields you can use in a Power Table
- Fields: Normal fields to bring data from Salesforce, as we used in the tutorial.
- Static: fields to write static text. Index: fields to show rows as a numbered list.
- Icon: fields with on-click actions so we can trigger actions once they are clicked. Titan has many icon options to choose from.
- Button: fields with on-click actions so we can trigger actions once they are clicked. With Titan, you can set up button styling.
- Input fields: give your end users the option to input data into the Power Table, which can be pushed to Salesforce.
05 Triggering Actions From Power Tables
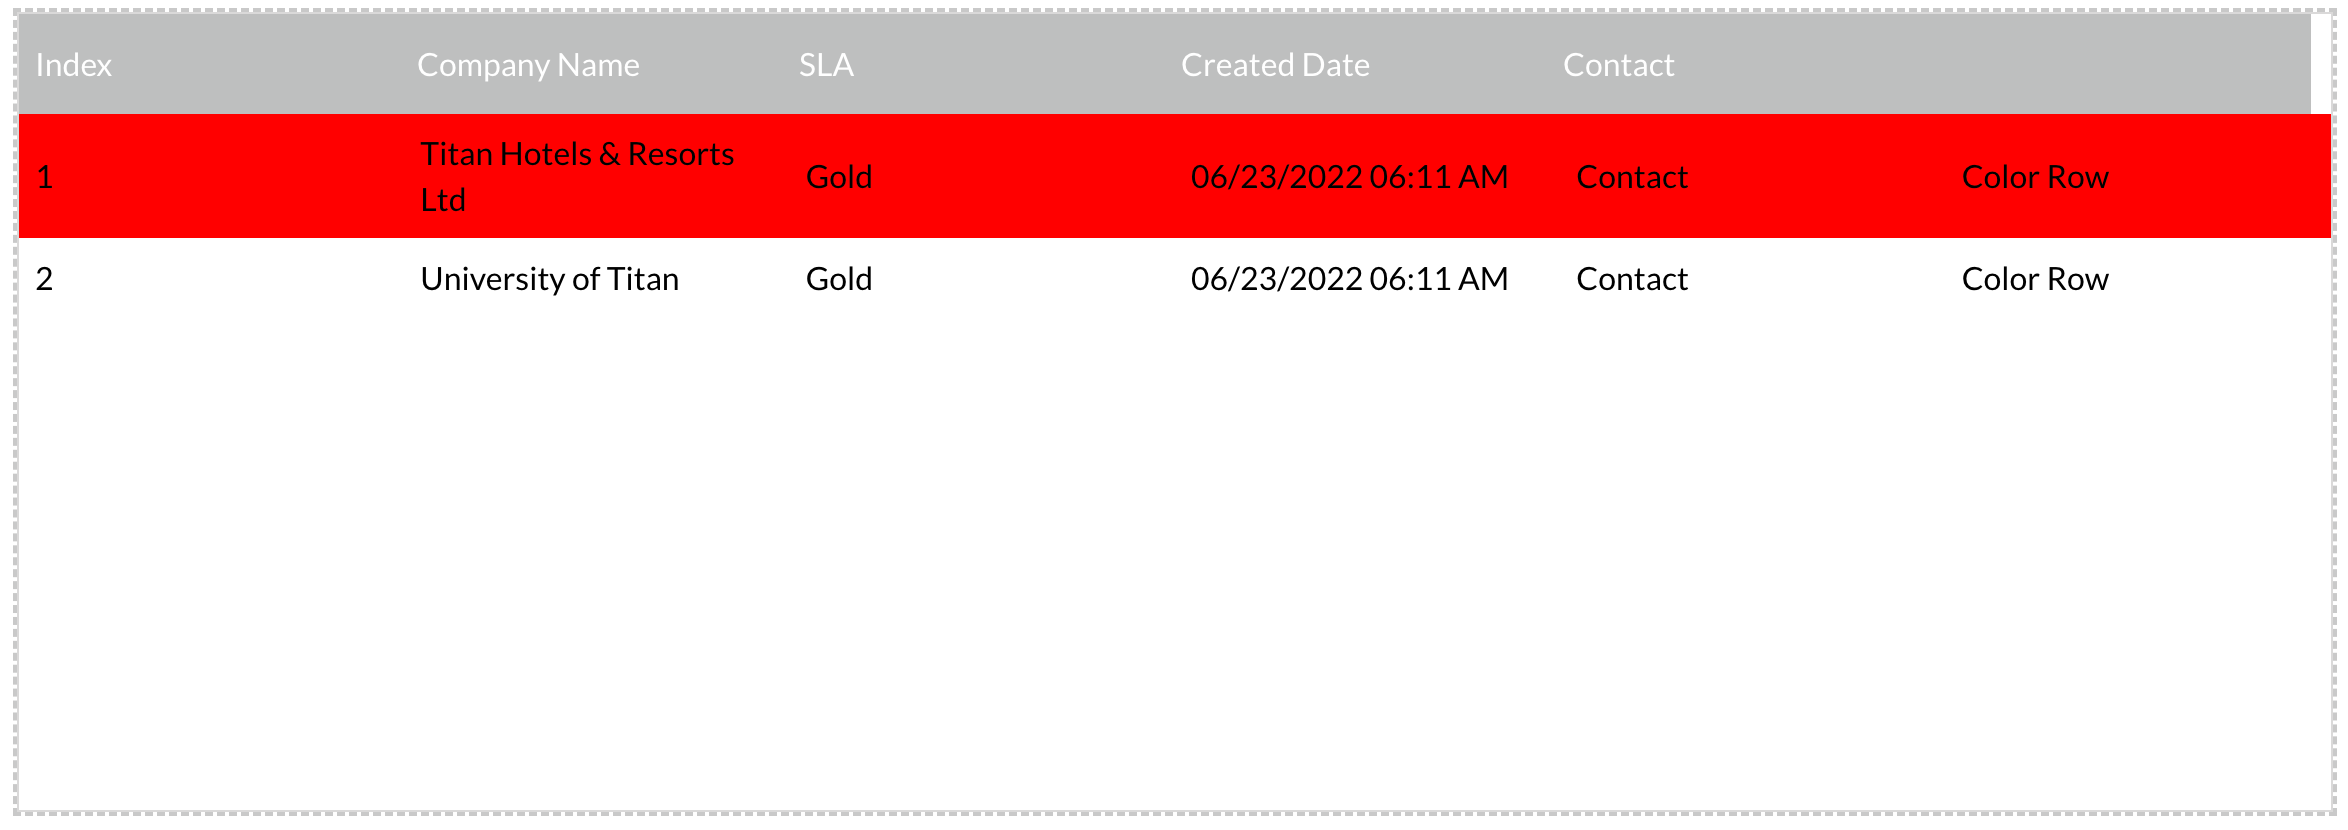
This tutorial will show you how to quickly highlight rows in your Power Table with a specific color if clicked.
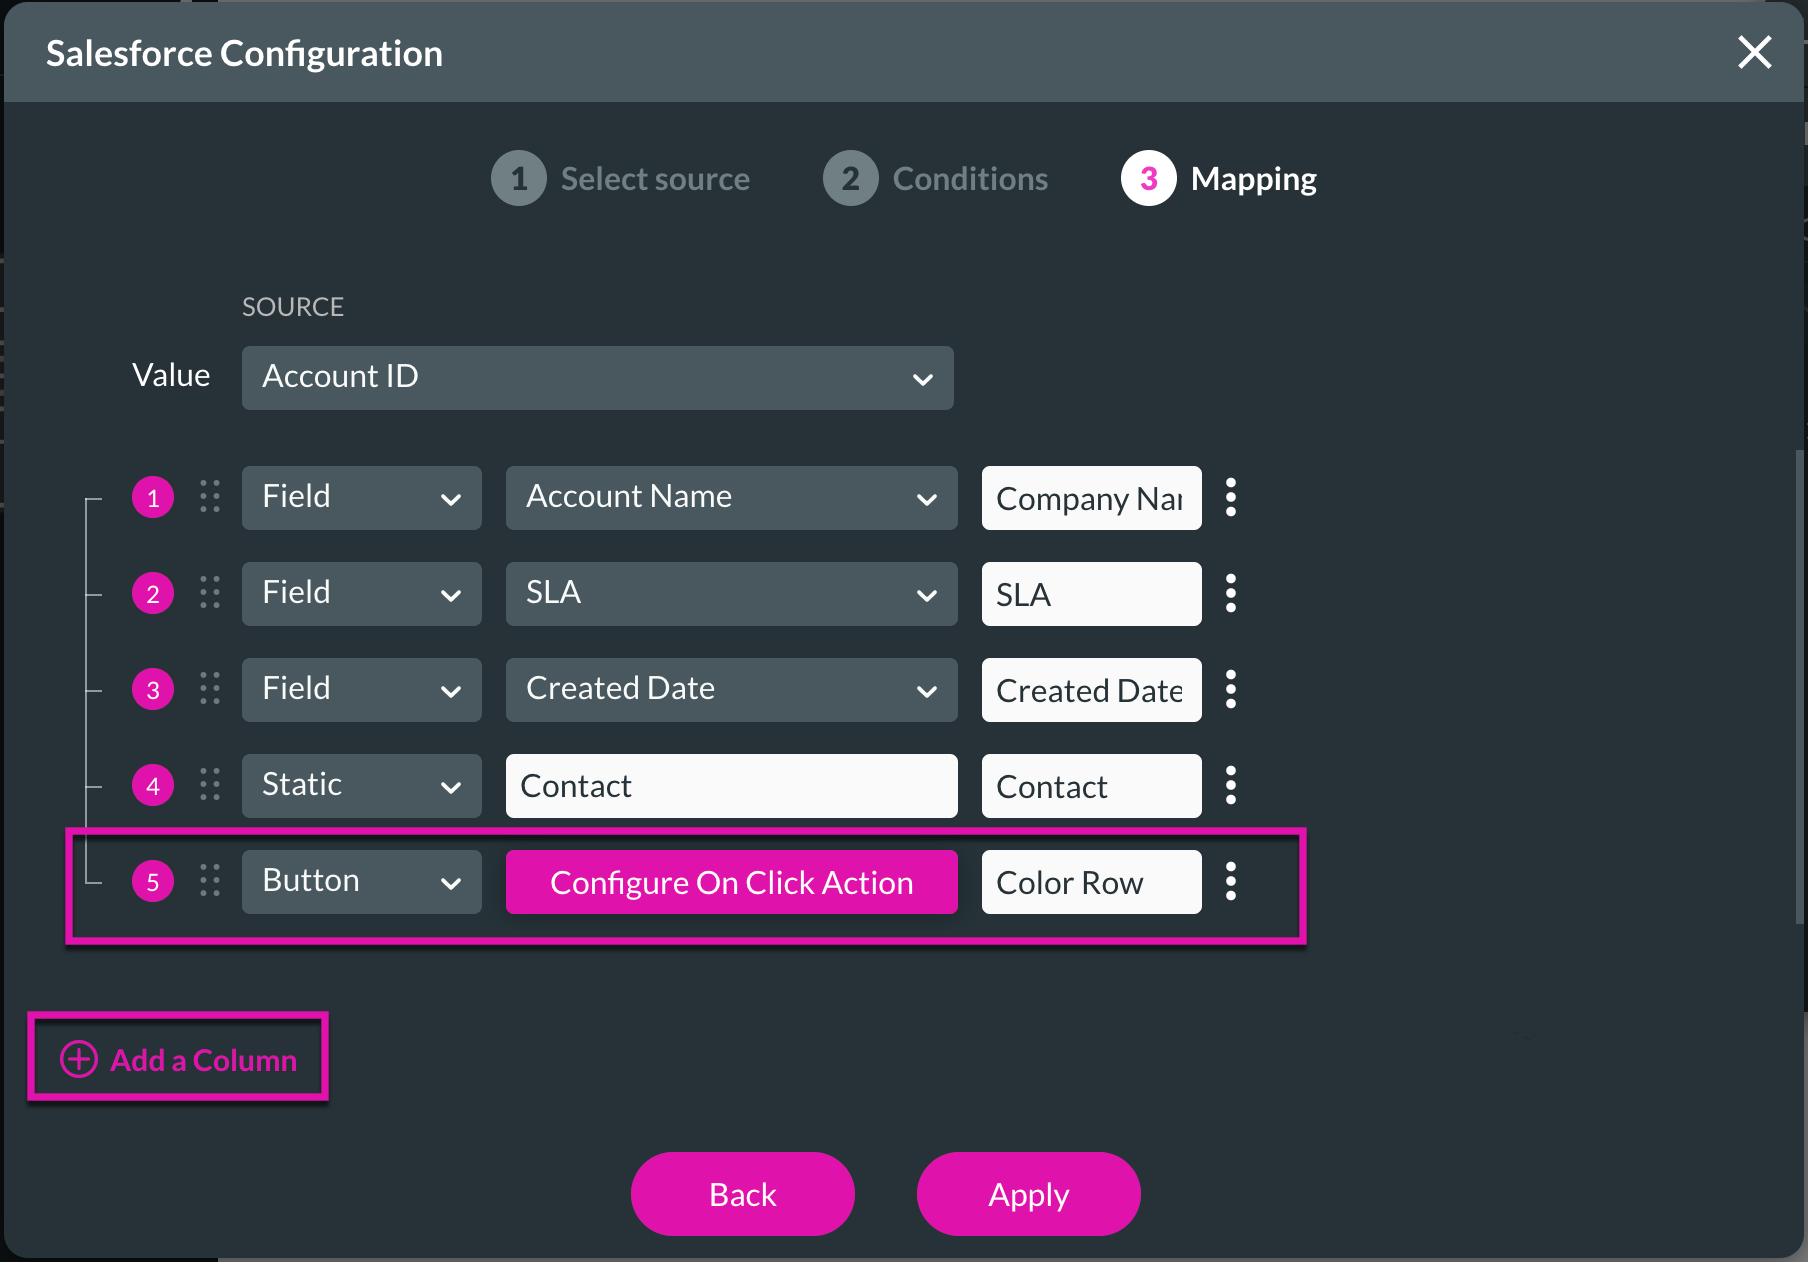
1. Add a Button field with the + Add a Column button and rename the label before clicking on the Configure On Click Action button.
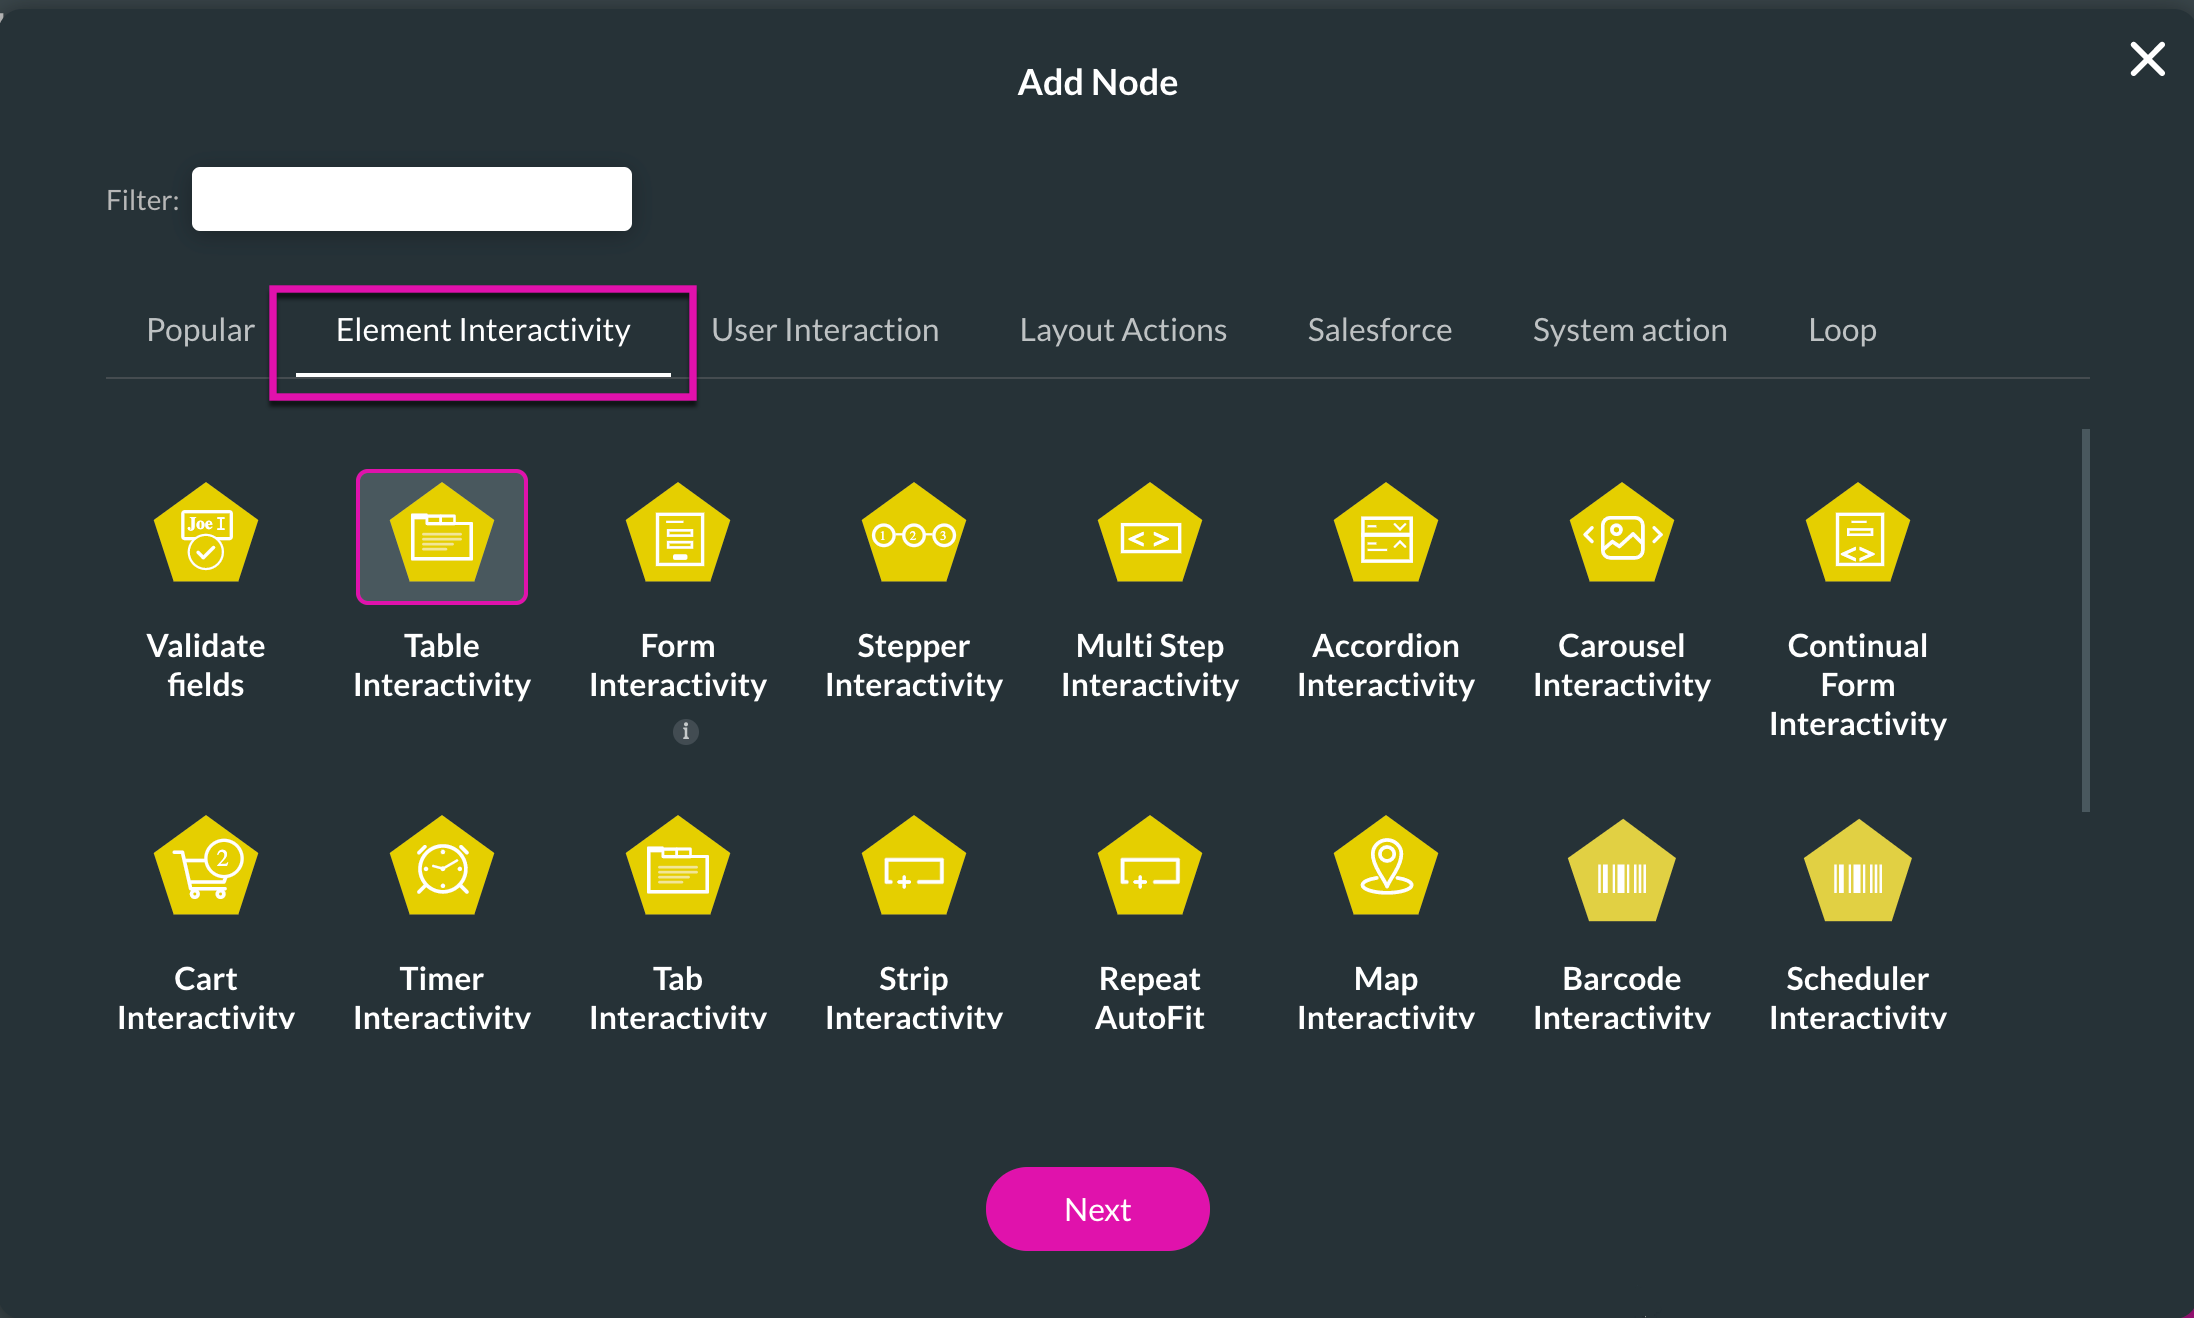
2. Choose Table Interactivity as an on-click action. It can be found under Element Interactivity.
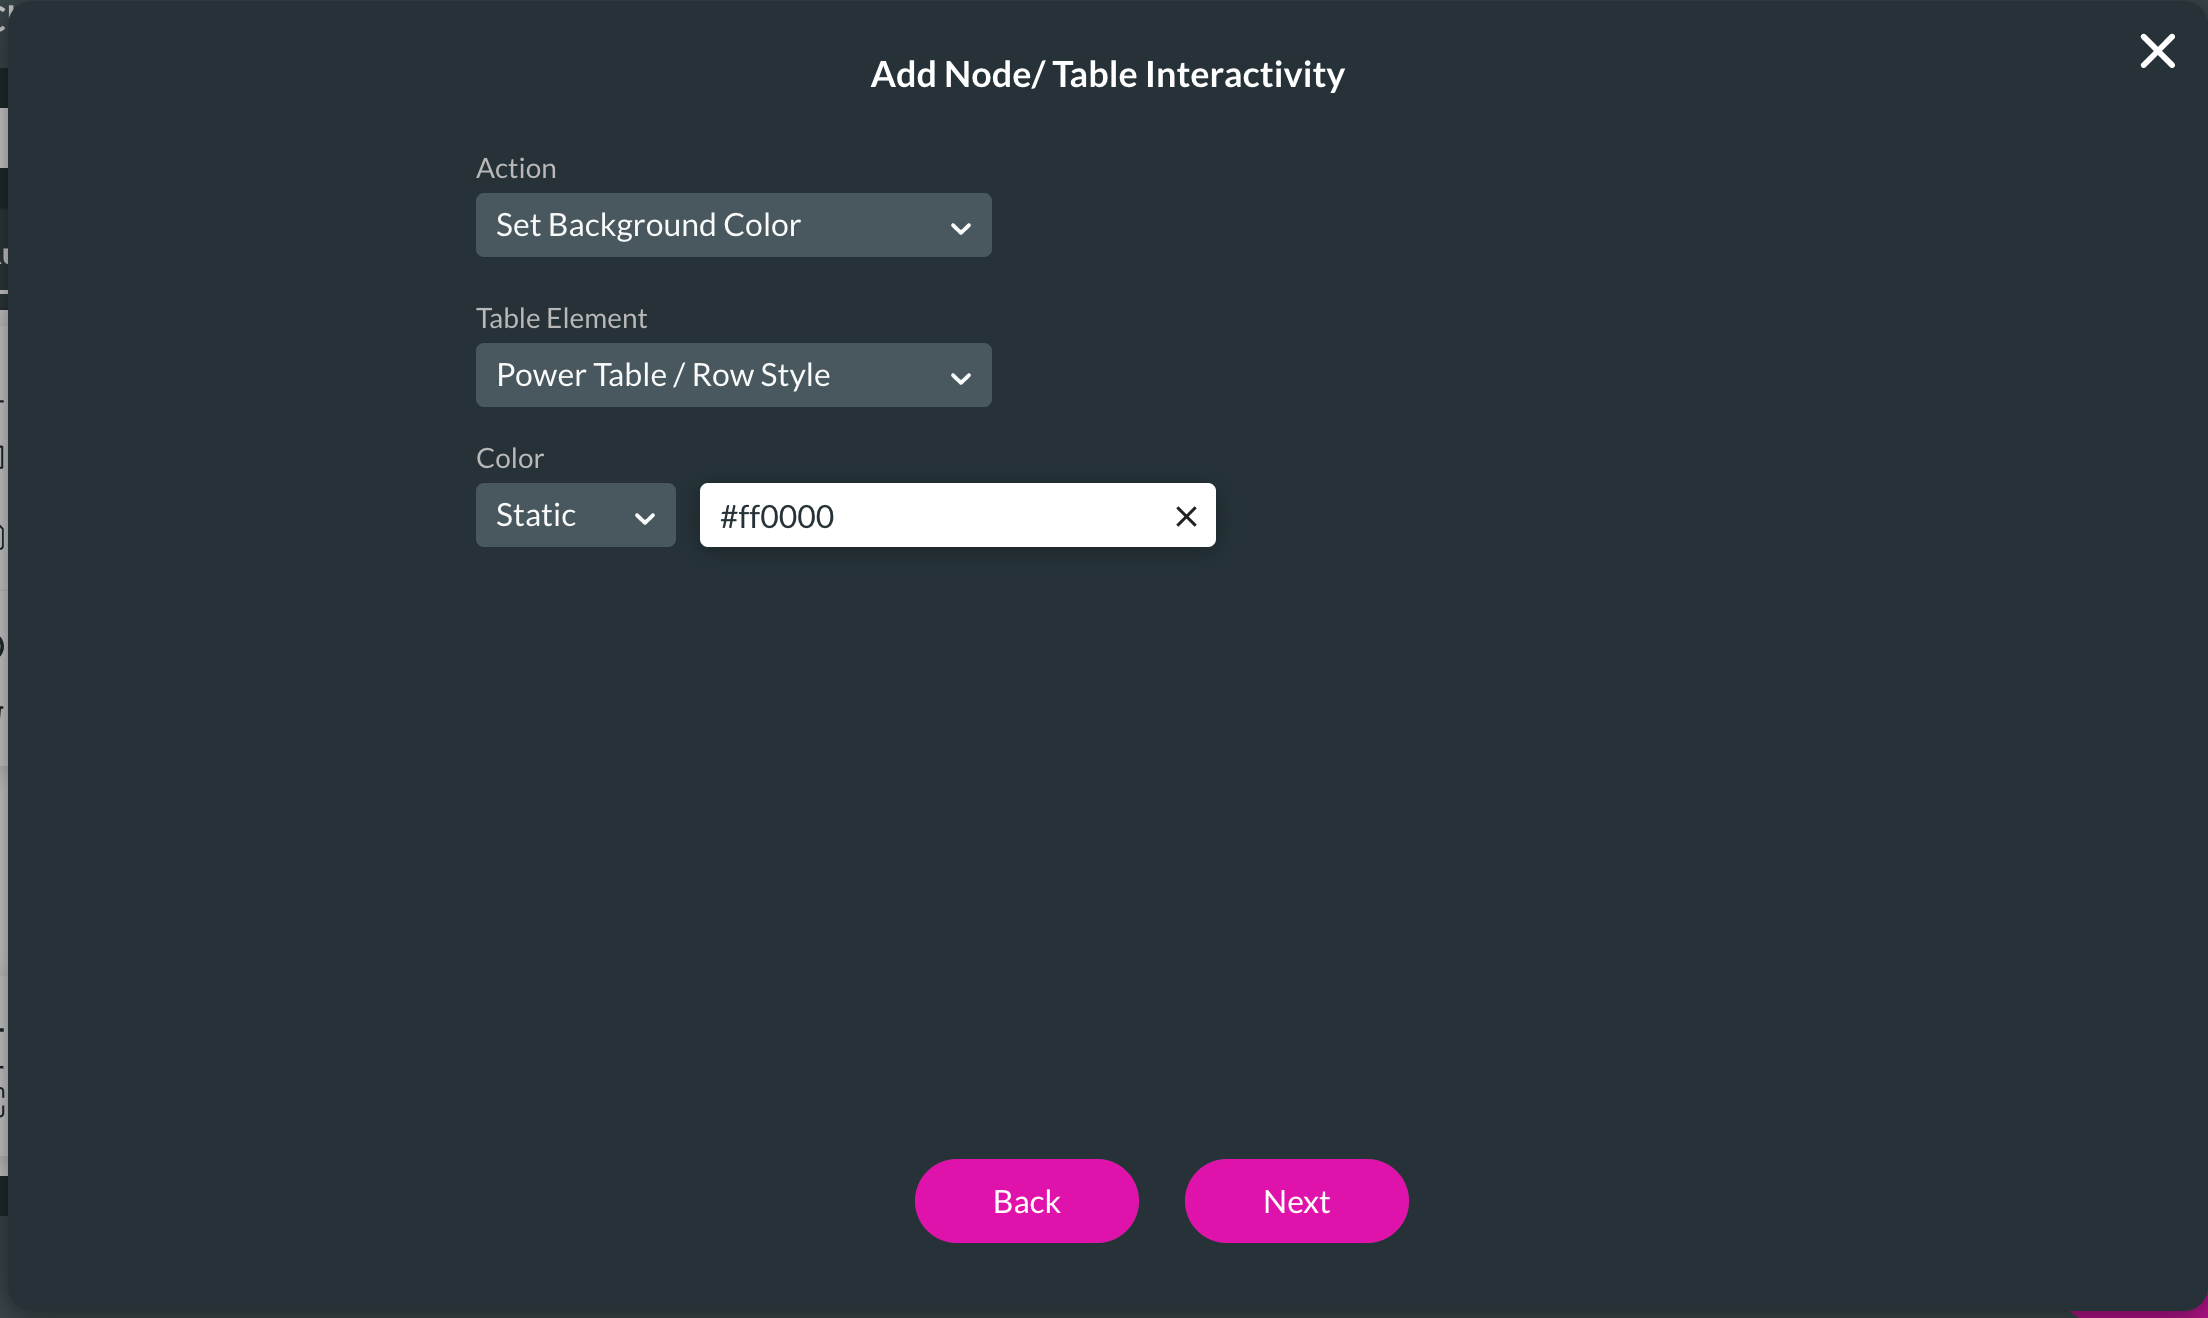
3. Choose Set Background Color as an Action and select Row Style from the drop-down menus.
4. Set up the color you desire with a hex code.
5. Click the Next button to add a tag and apply the config.
1. Add a Button field with the + Add a Column button and rename the label before clicking on the Configure On Click Action button.

2. Choose Table Interactivity as an on-click action. It can be found under Element Interactivity.

3. Choose Set Background Color as an Action and select Row Style from the drop-down menus.
4. Set up the color you desire with a hex code.
5. Click the Next button to add a tag and apply the config.

06 Formatting your Power Table
In this mini tutorial, we will format the Created Date column.
1. Select the Columns section in Power Table Settings and click on Column 3’s Gear icon.
2. Select a format from the drop-down list that works for you.
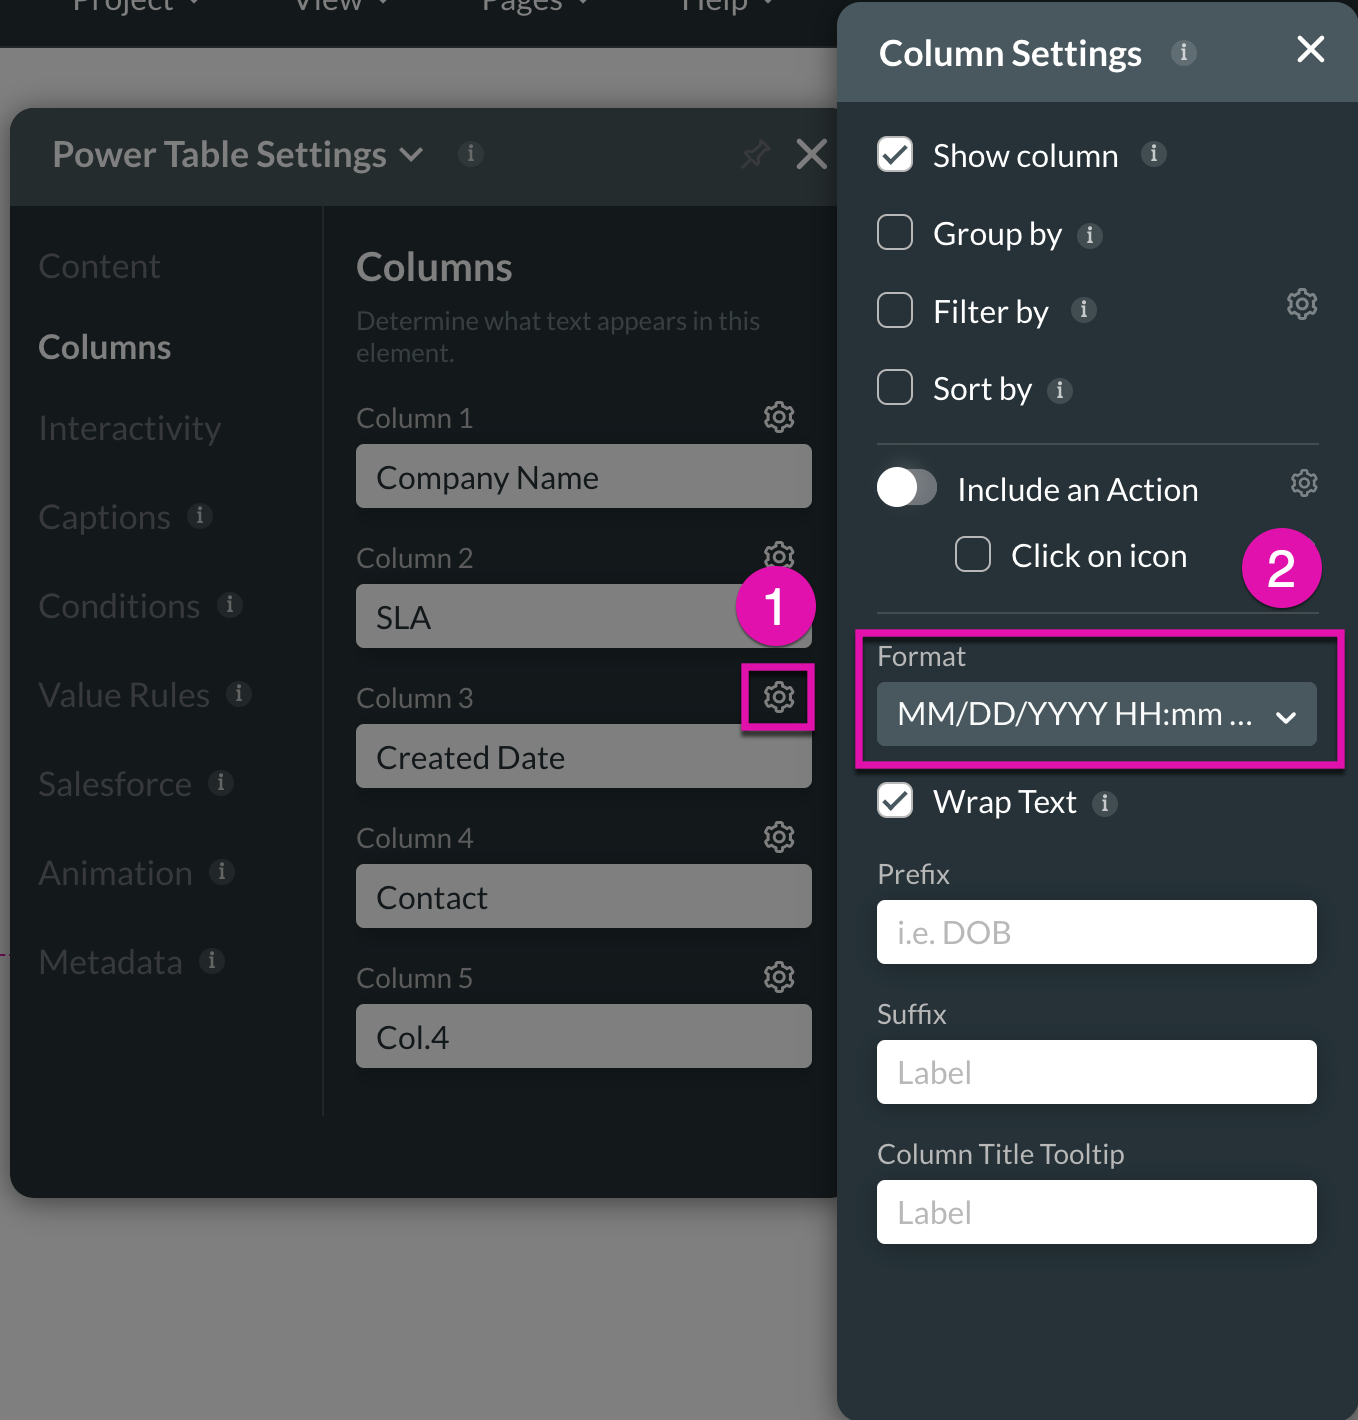
1. Select the Columns section in Power Table Settings and click on Column 3’s Gear icon.
2. Select a format from the drop-down list that works for you.

07 Testing your Power Table
1. Click the Save and Preview buttons to test your Power Table.
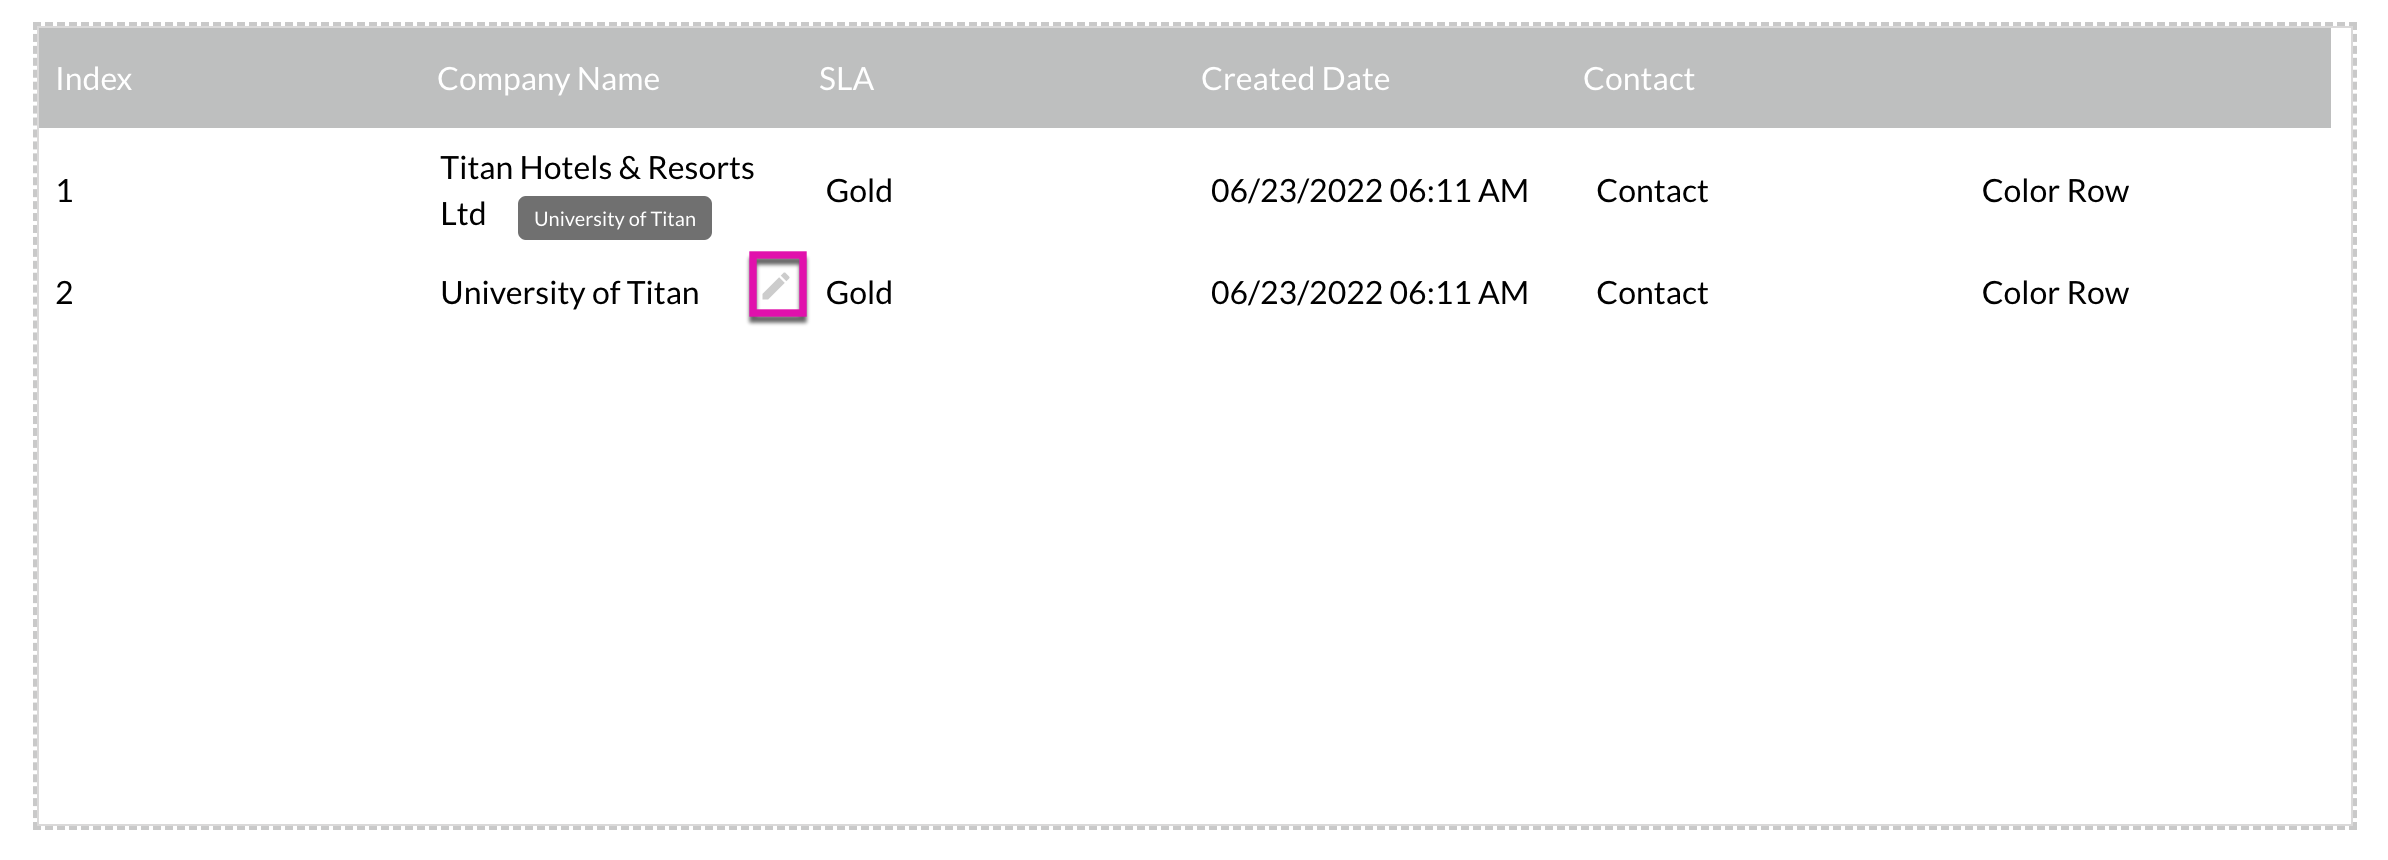
The Power Table opens in a new browser tab and contains all the columns set up, such as index, company name, SLA, created date, and contact.
2. Click on the pencil icon in the Company Name row to edit the data and automatically push the data to Salesforce in real time.
3. Highlight or color a row on the Power Table by clicking on a specific row.
The Power Table opens in a new browser tab and contains all the columns set up, such as index, company name, SLA, created date, and contact.
2. Click on the pencil icon in the Company Name row to edit the data and automatically push the data to Salesforce in real time.

3. Highlight or color a row on the Power Table by clicking on a specific row.

08 Sub Components and Power Tables
We need to configure a sub-component to view the contacts under an account.
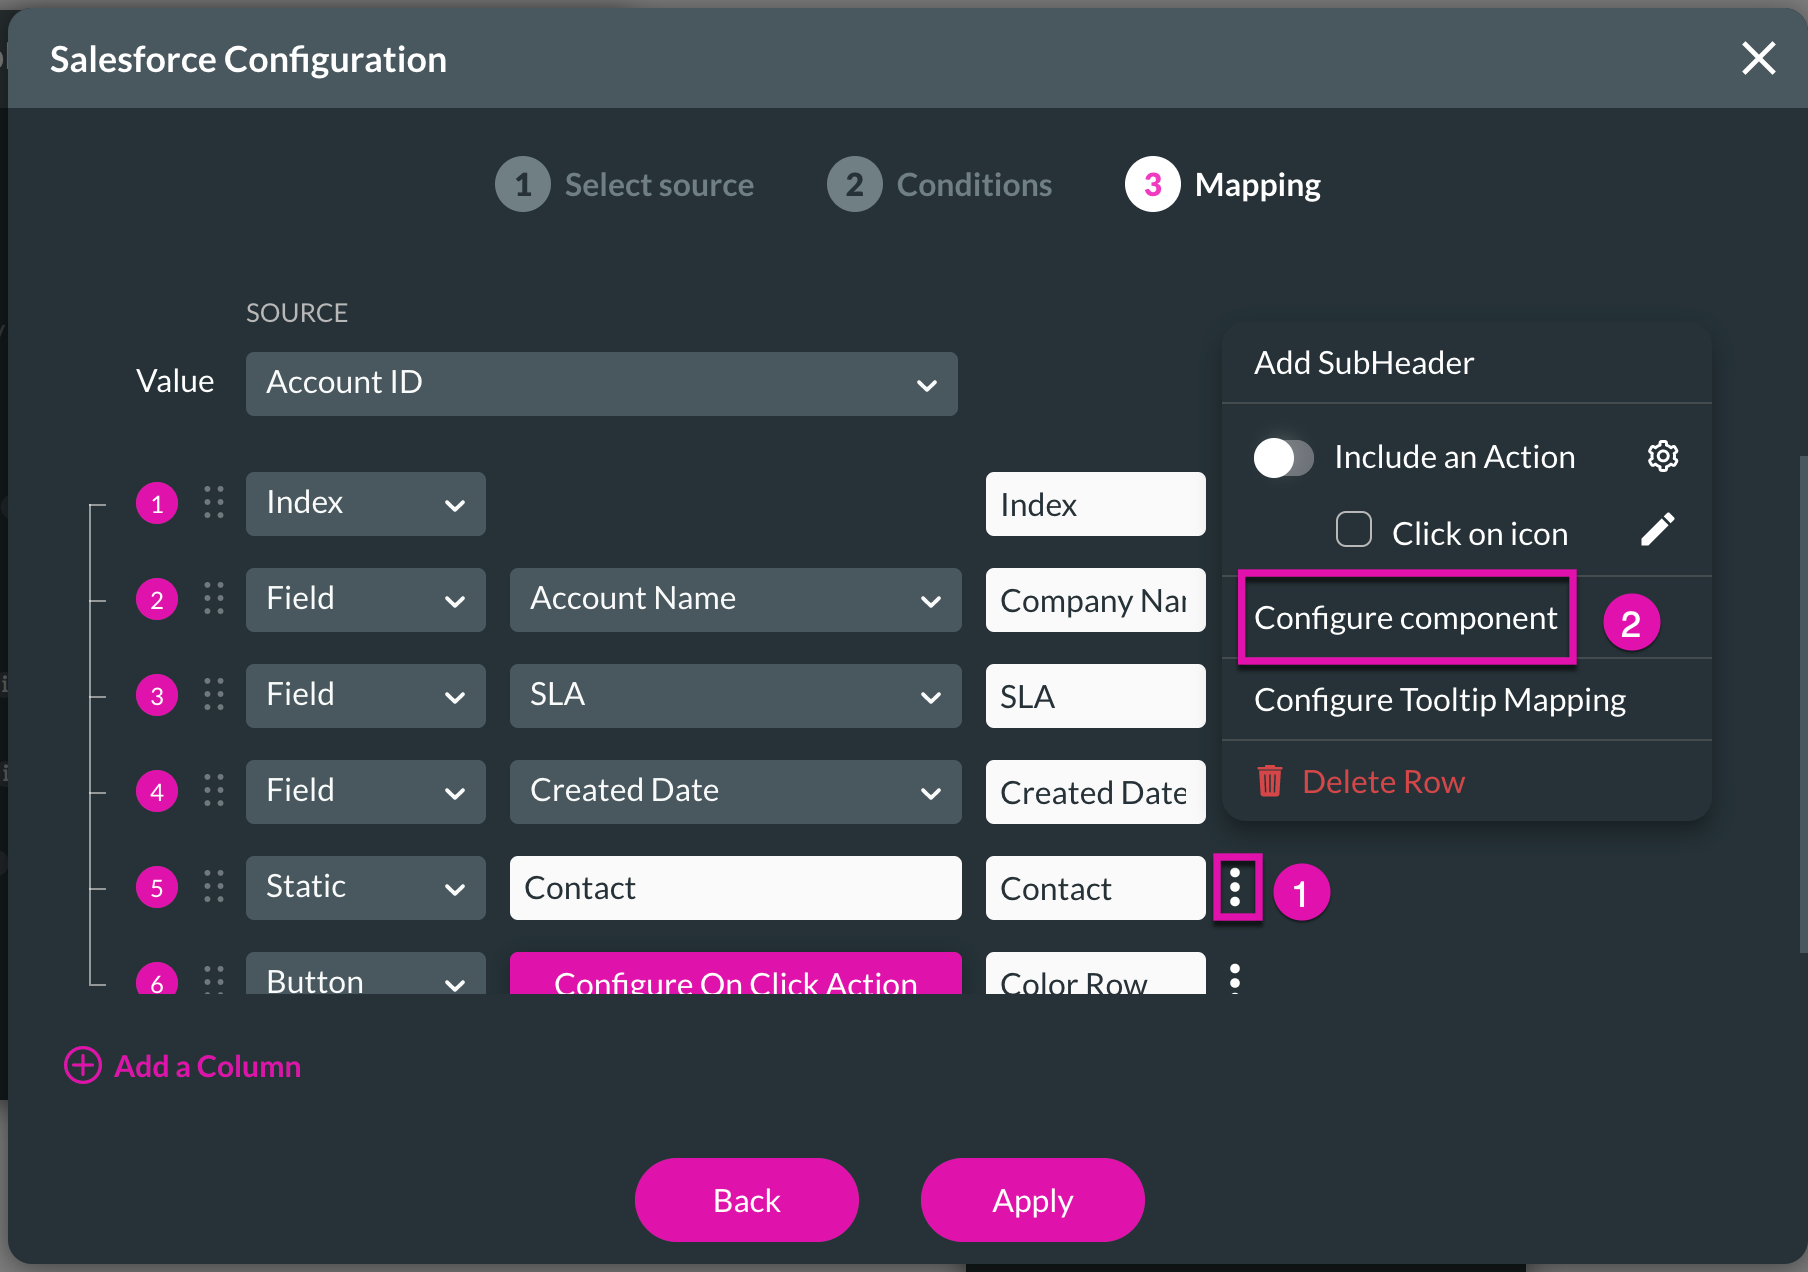
1. Under Content Mapping, click the Kebab button next to the Contact field and select the Configure Component option.
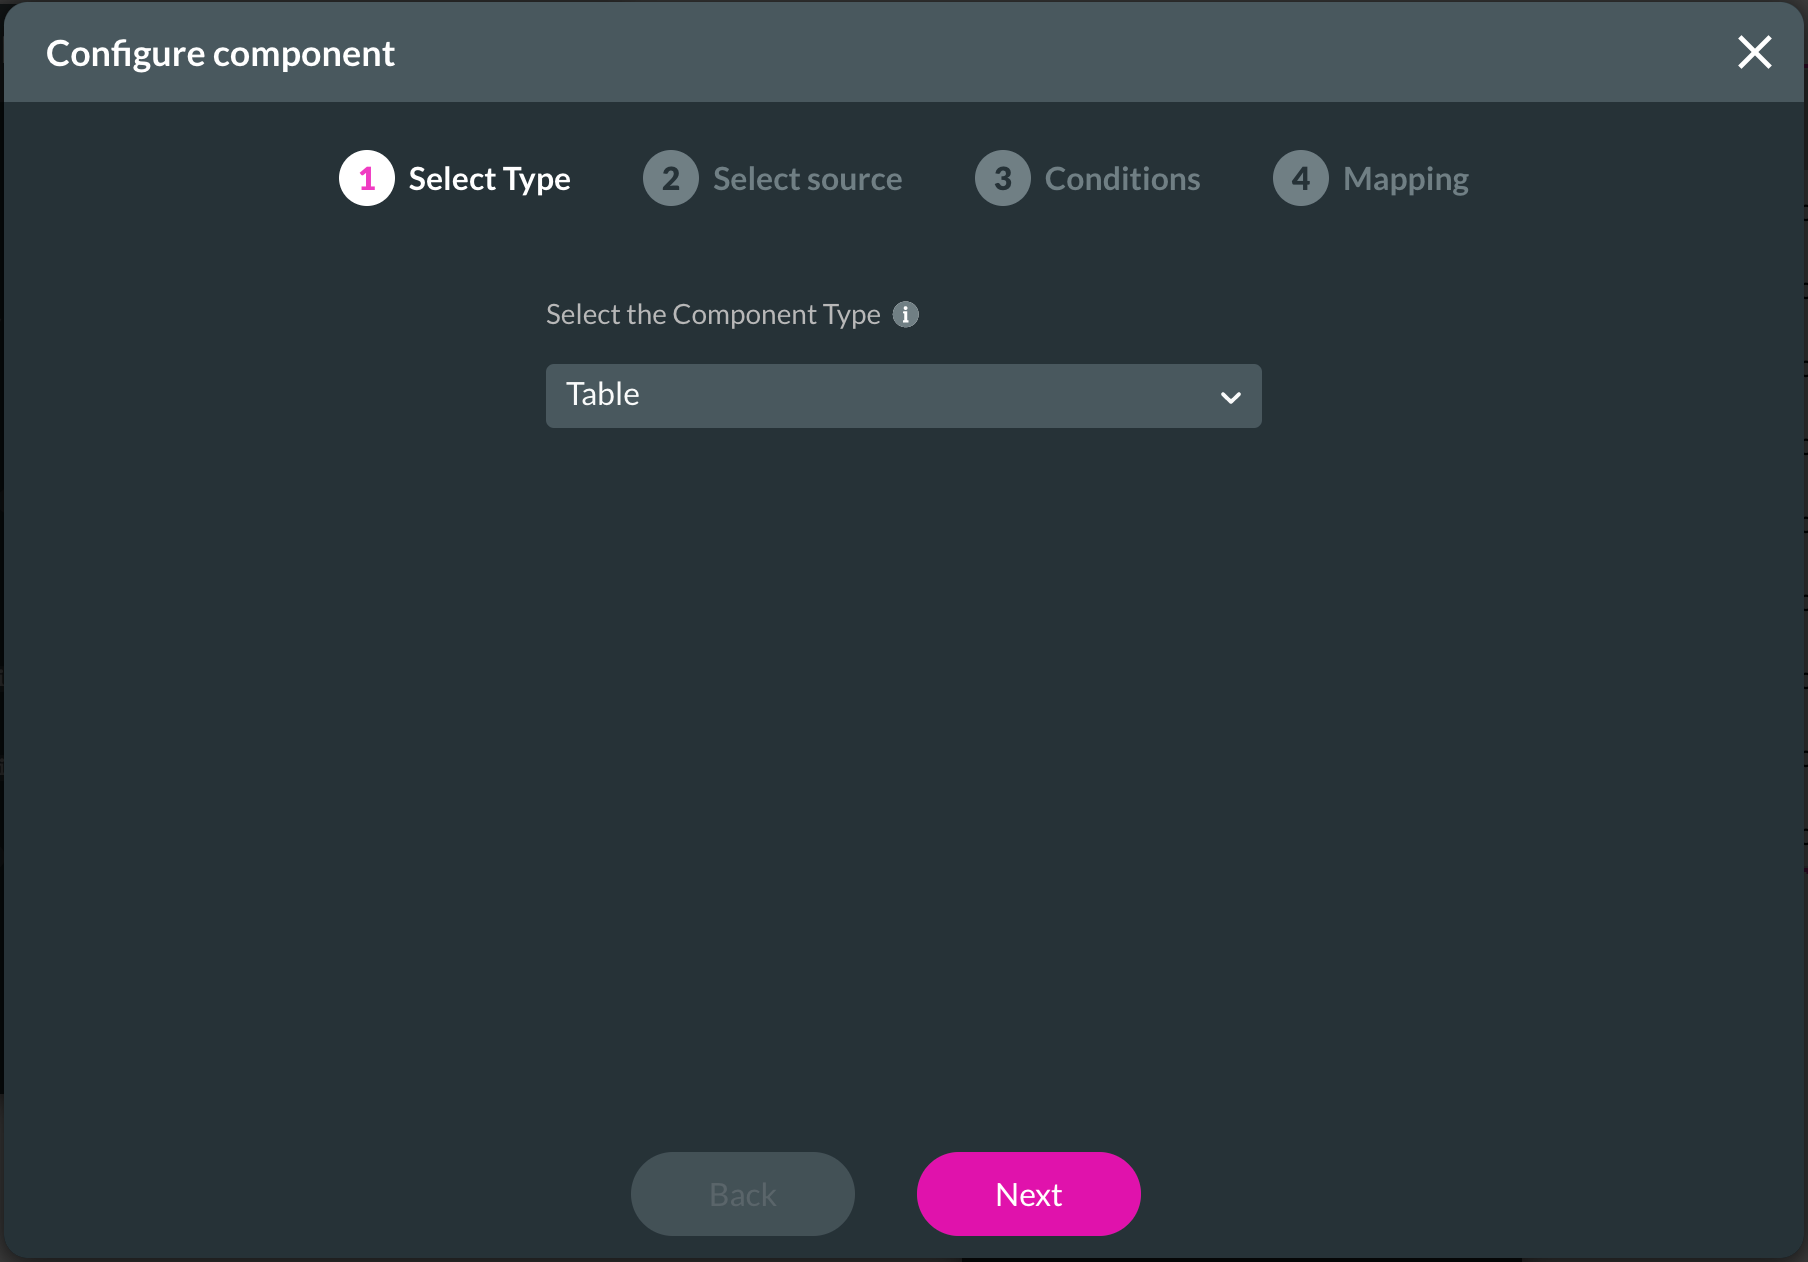
2. Choose Table as a component from the Component Type drop-down list and click on the Next button.
3. From the drop-down Source list, select your object from Salesforce and click on the Next button. For this tutorial, we will choose Contact.
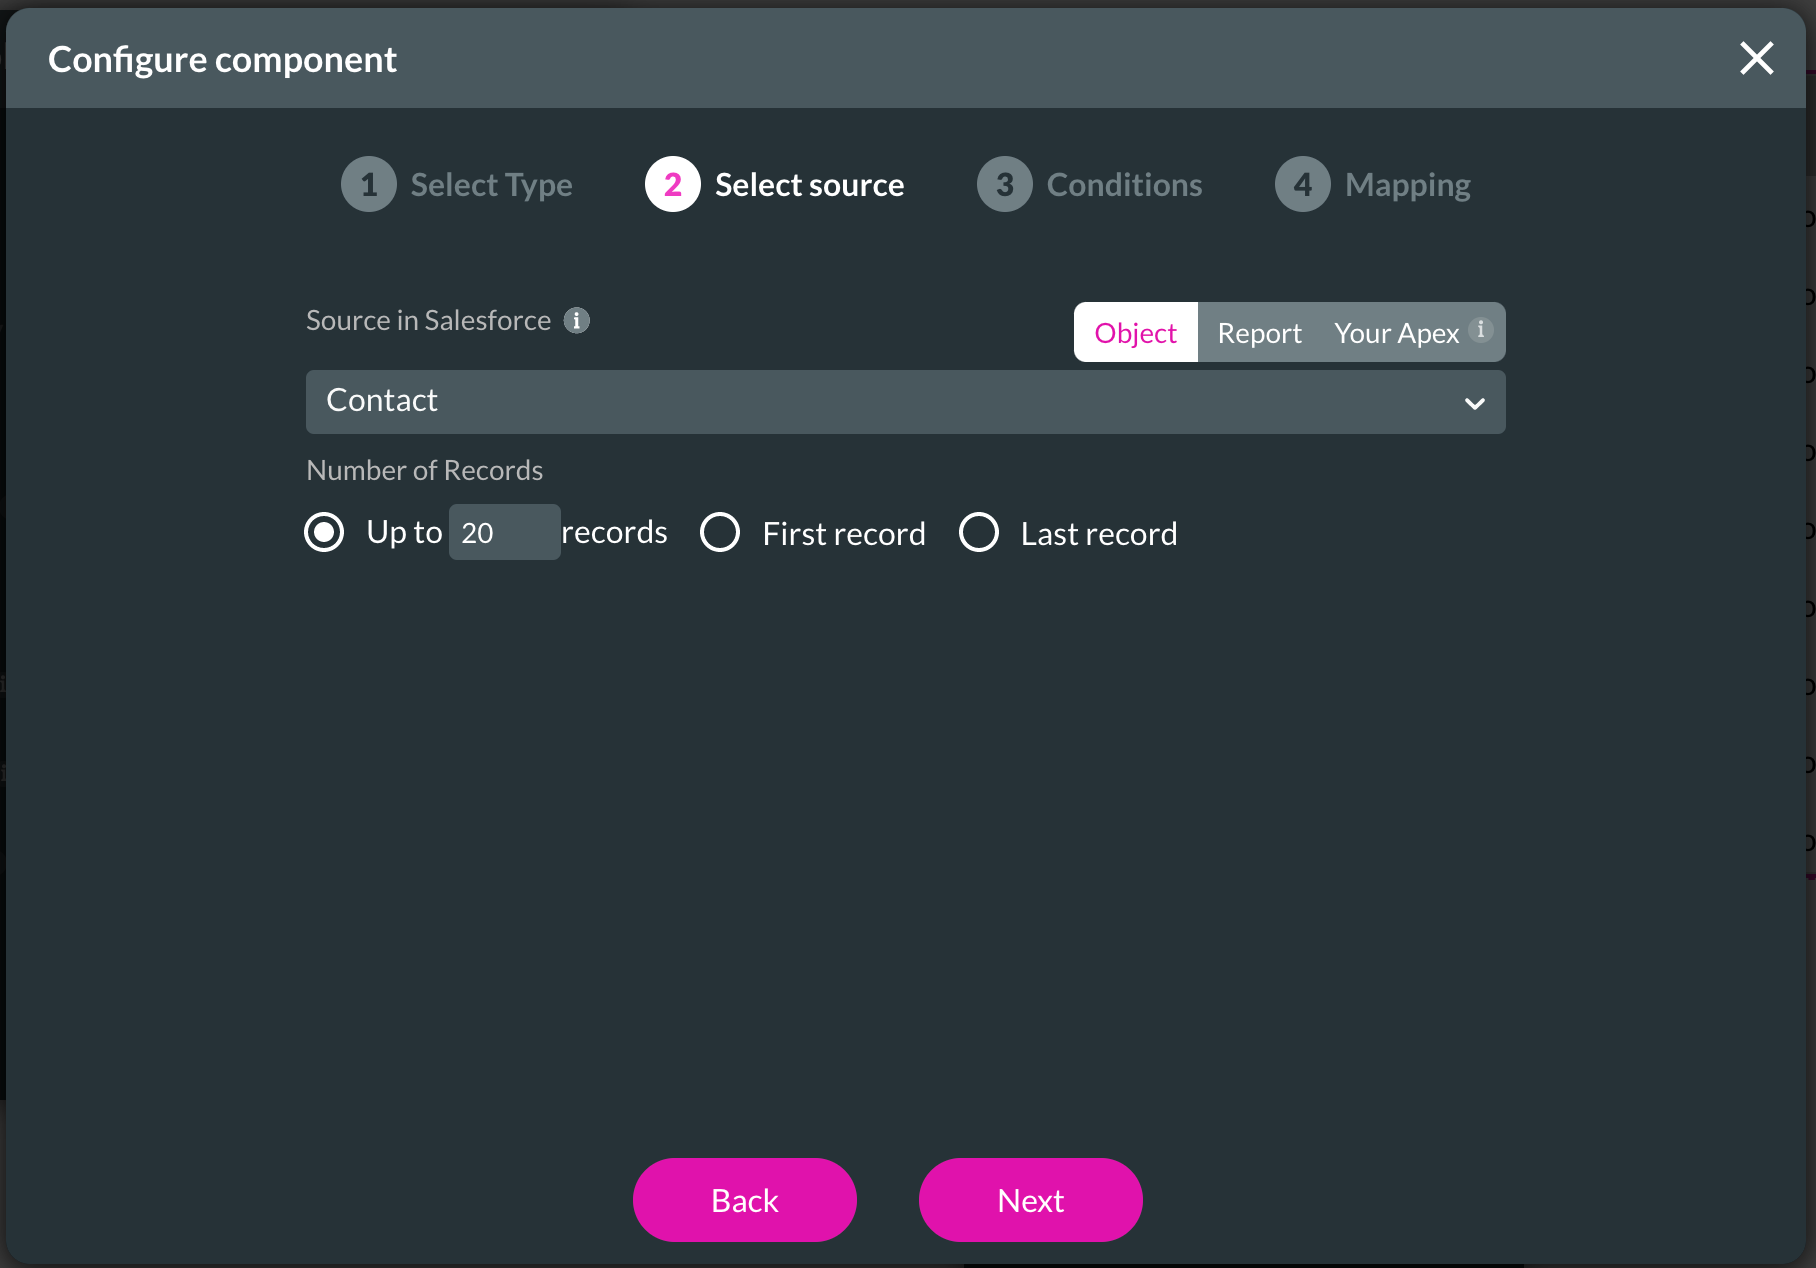
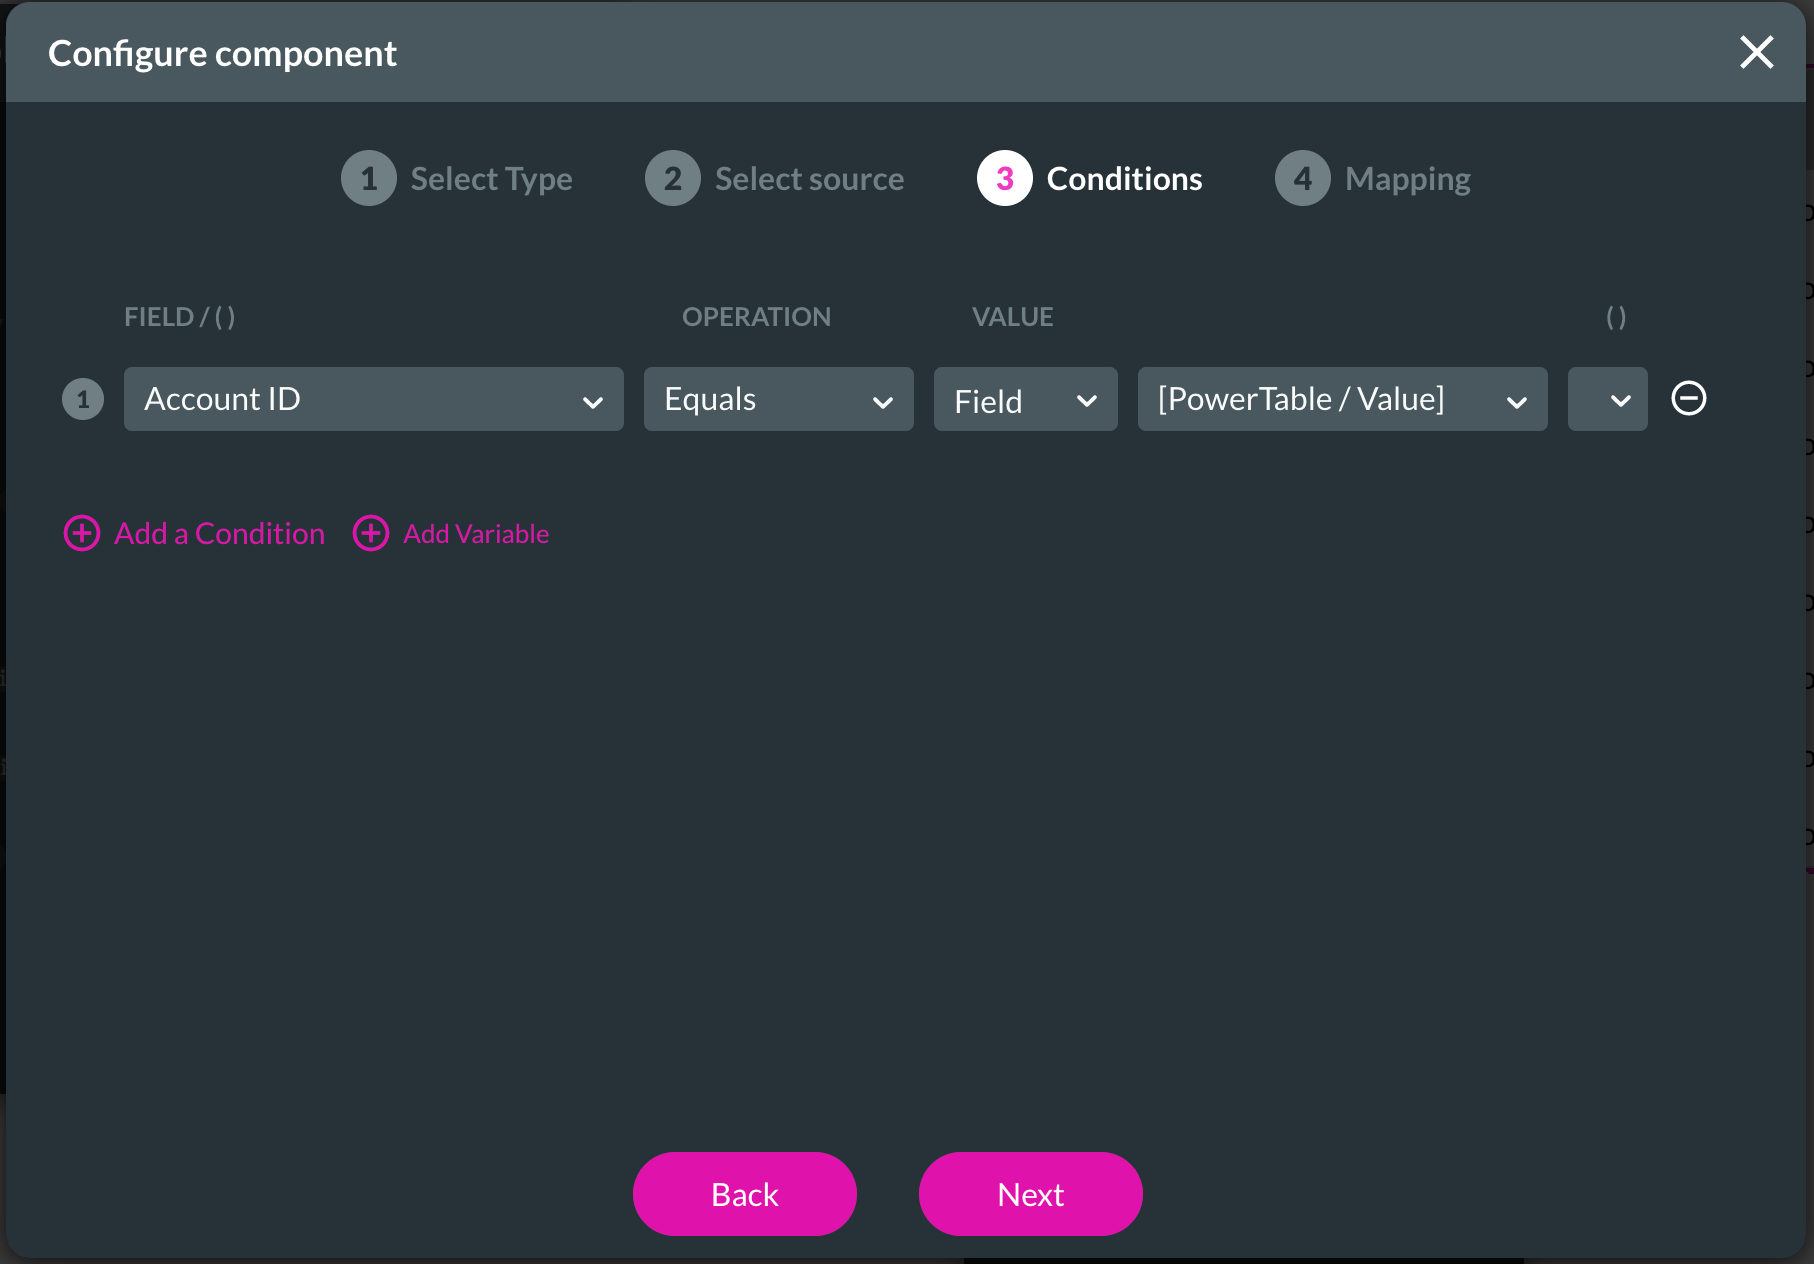
4. Configure the conditions for your sub-component and click Next.
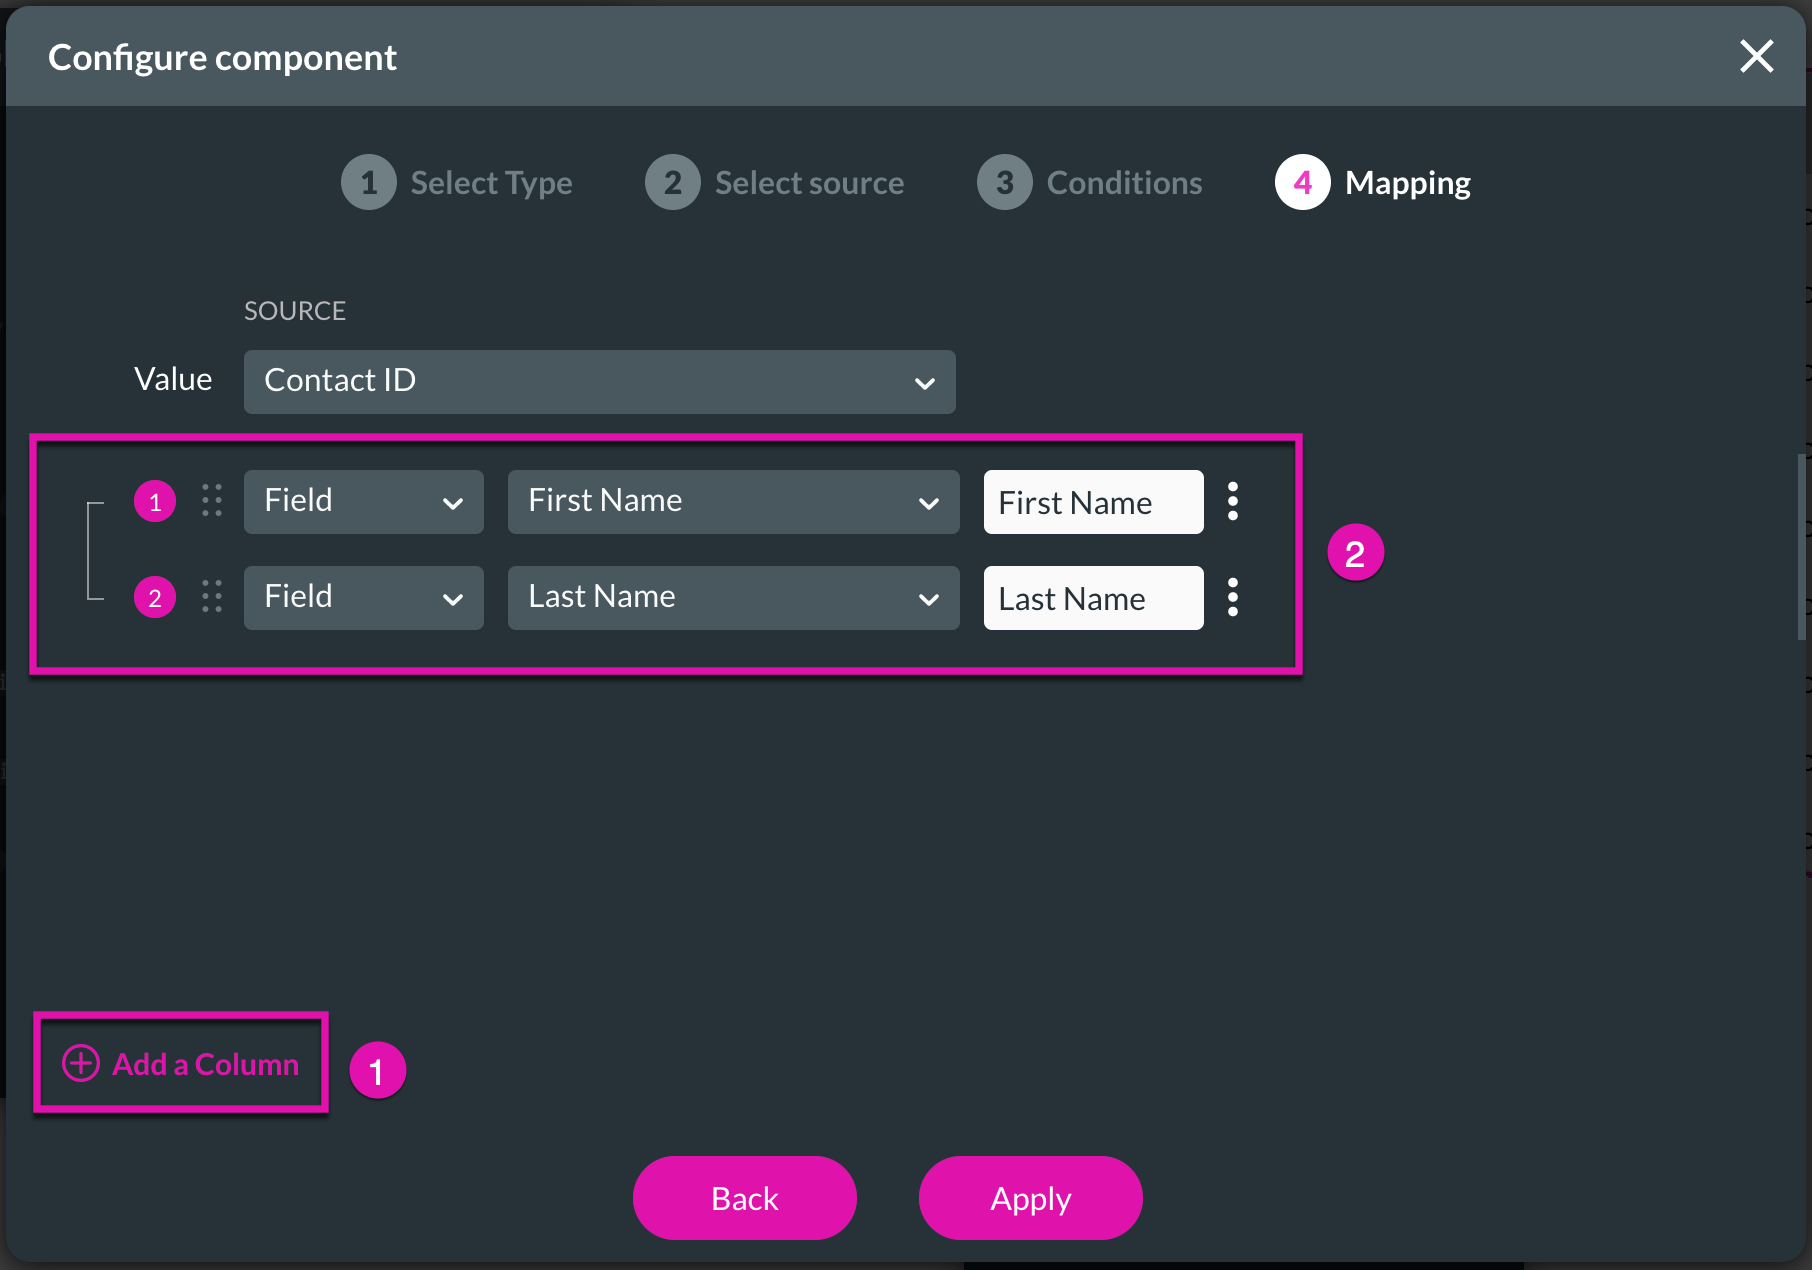
5. Add and map a few simple fields by clicking the + Add a Column button before choosing Apply.
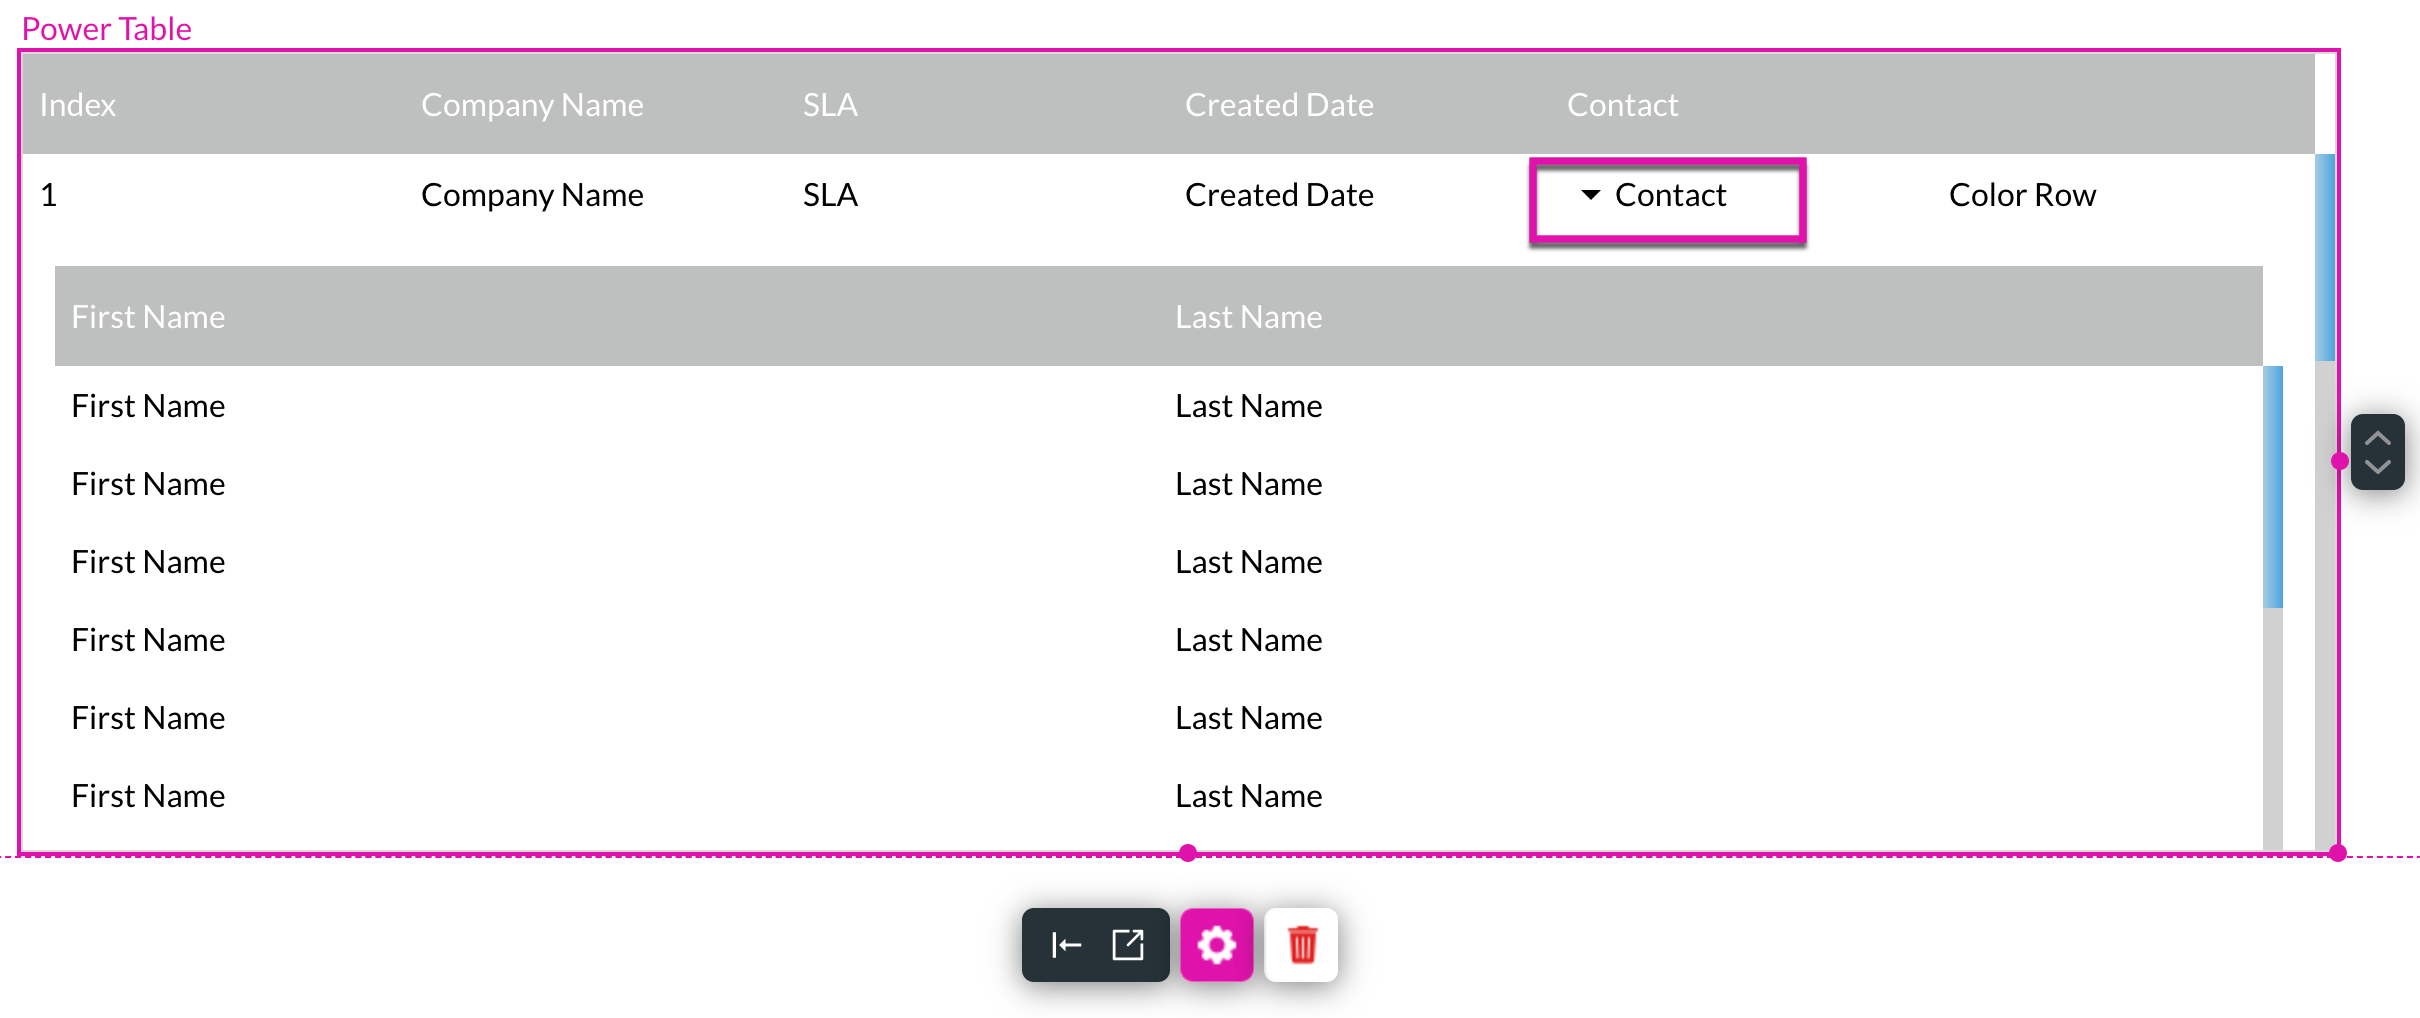
Look at your Power Table, and you will notice that a sub-component has been applied.
1. Under Content Mapping, click the Kebab button next to the Contact field and select the Configure Component option.

2. Choose Table as a component from the Component Type drop-down list and click on the Next button.

3. From the drop-down Source list, select your object from Salesforce and click on the Next button. For this tutorial, we will choose Contact.

4. Configure the conditions for your sub-component and click Next.

5. Add and map a few simple fields by clicking the + Add a Column button before choosing Apply.

Look at your Power Table, and you will notice that a sub-component has been applied.

09 Add Extra Interactivity to your Power Table Quickly
- Auto Grow: This function ensures that your Power Table automatically resizes based on the number of returned records.
- Allow Sorting: Sort your data in your Power Table by the column of your choice.
- Allow Filtering: Filters your data in a Power Table based on the column of your choice.
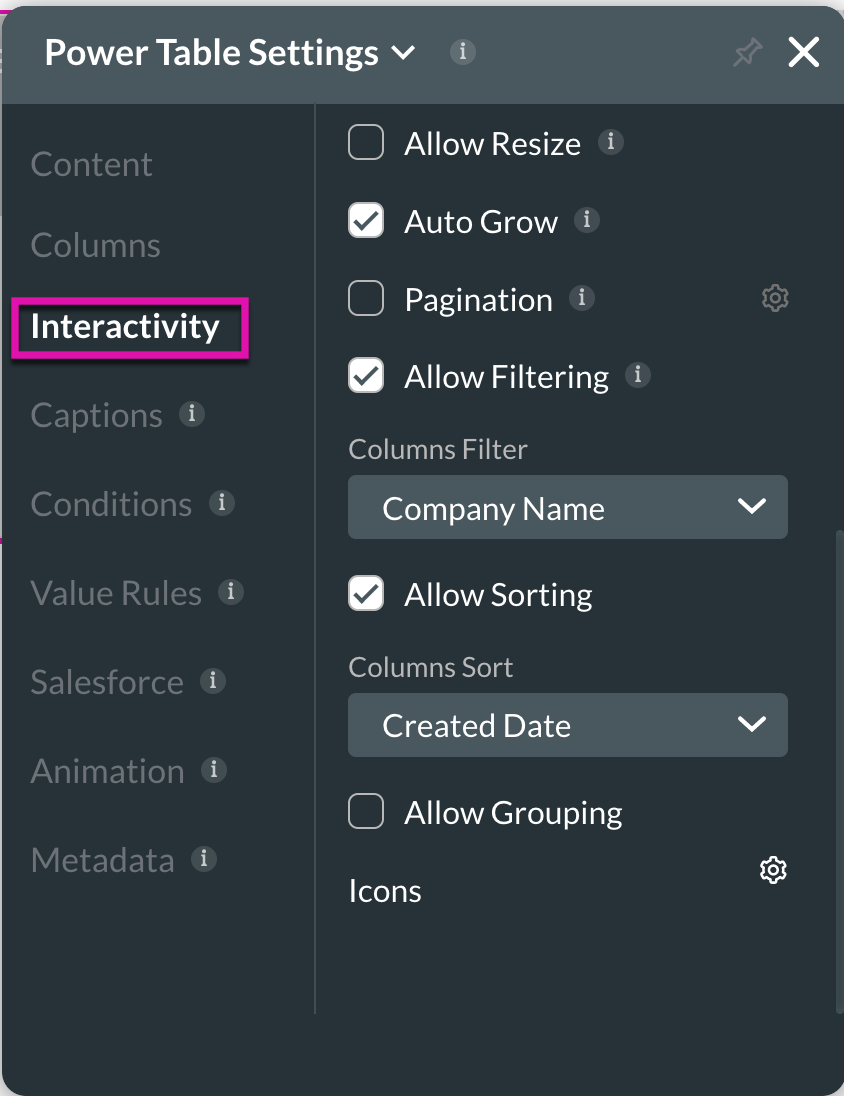
Below is an example of the Power Table with a filter on Company Name and a Sort function added to Created Date.
