Source and Limits (8 min)
Completion requirements
01 Getting Started
This tutorial covers configuring a source using Power Tables' report and apex options, as well as where data can be pulled from in Salesforce.
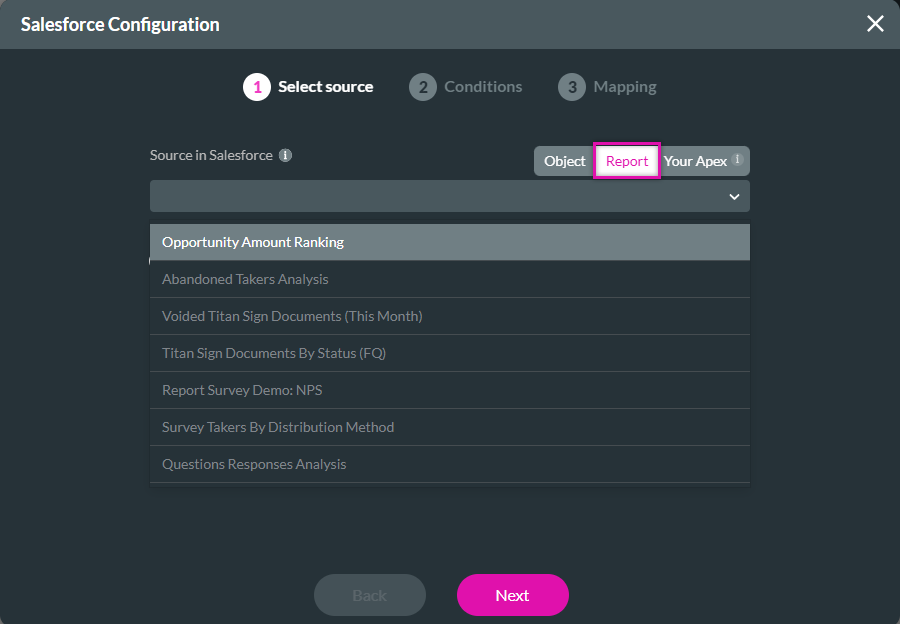
02 Report
As the integration user, you need to have recently accessed a report in order to query it. If you do not see the report in the Source in Salesforce dropdown, navigate to your Salesforce account and view it; it will now be in the list.
When to use the report option:
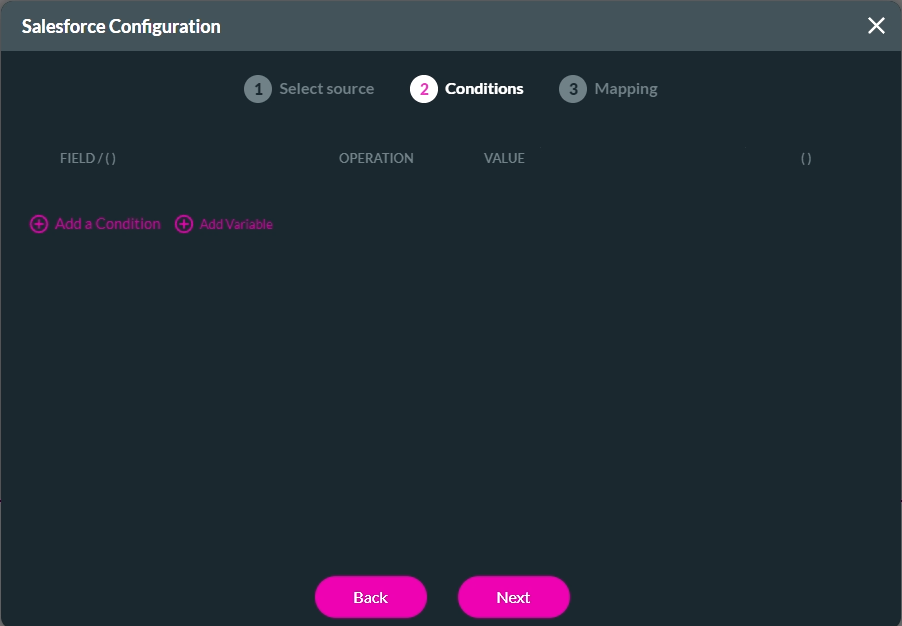
Conditions: You can choose not to configure any conditions when using a report and pull in all information from the report. This is useful as reports will already have specific filtered information.
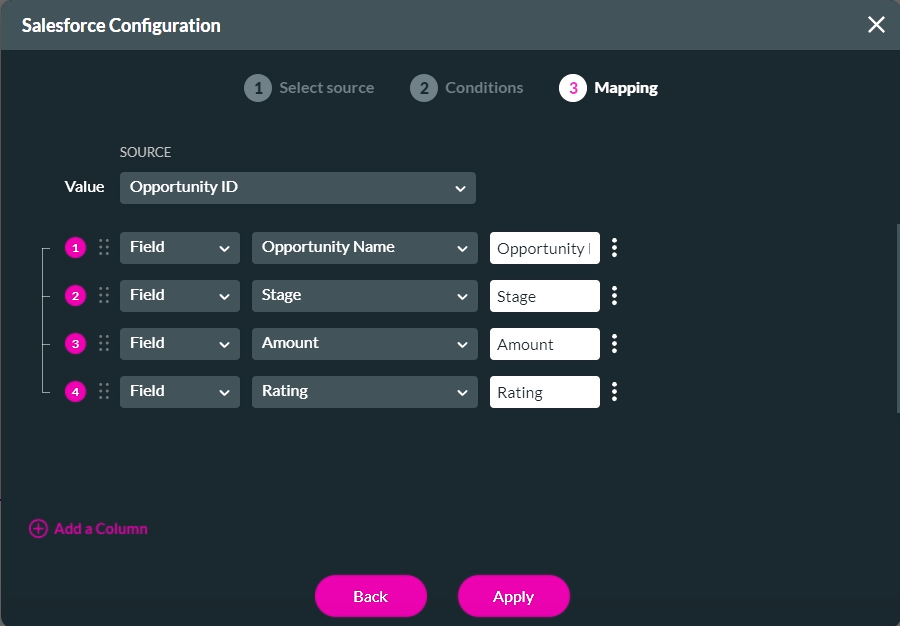
Mapping: Use the Value dropdown to configure the report value. The column configuration options will be dependent on the value selected.
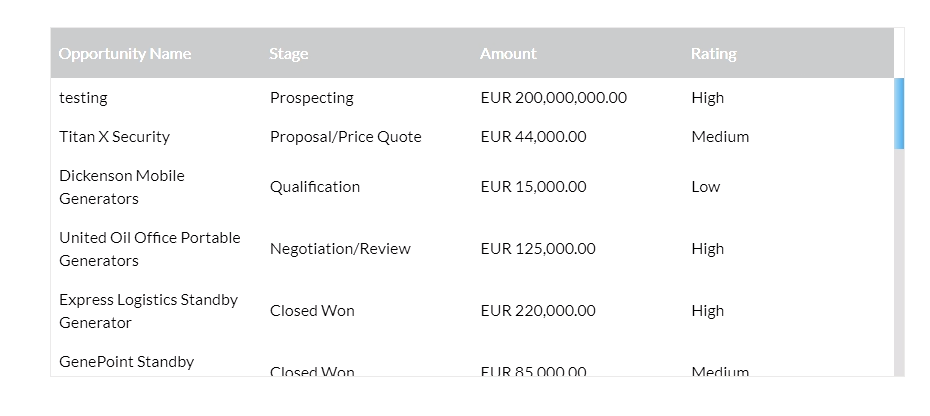
Save and Preview. The table displays the text rating values as they display in Salesforce.
When to use the report option:
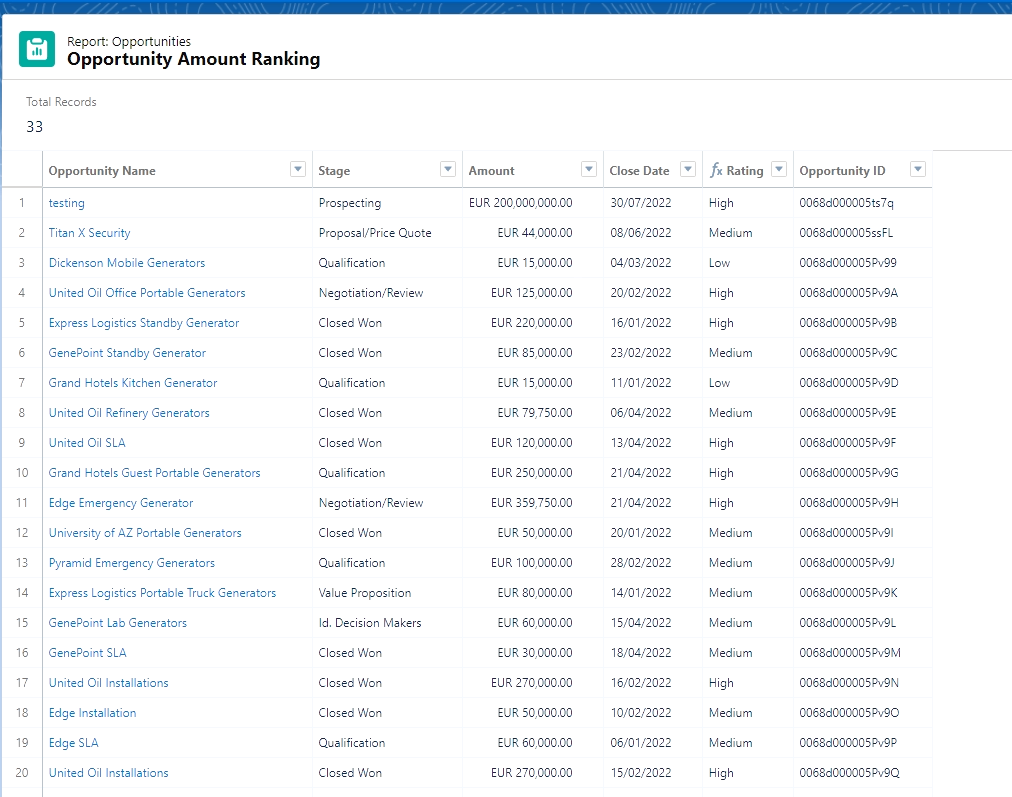
- You can query more records.
- A report can contain data from several objects or calculated data that a simple table cannot.
Conditions: You can choose not to configure any conditions when using a report and pull in all information from the report. This is useful as reports will already have specific filtered information.
Mapping: Use the Value dropdown to configure the report value. The column configuration options will be dependent on the value selected.
Save and Preview. The table displays the text rating values as they display in Salesforce.
03 Apex
Use the Apex option when bringing advanced calculations, multiple objects, and many records. For our example, bring in the advanced calculation - aggregated data.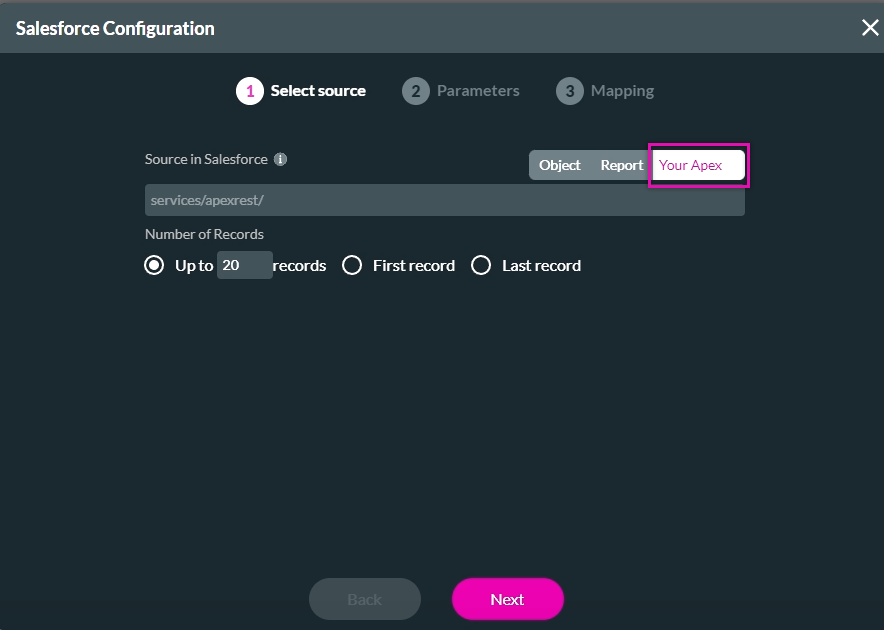
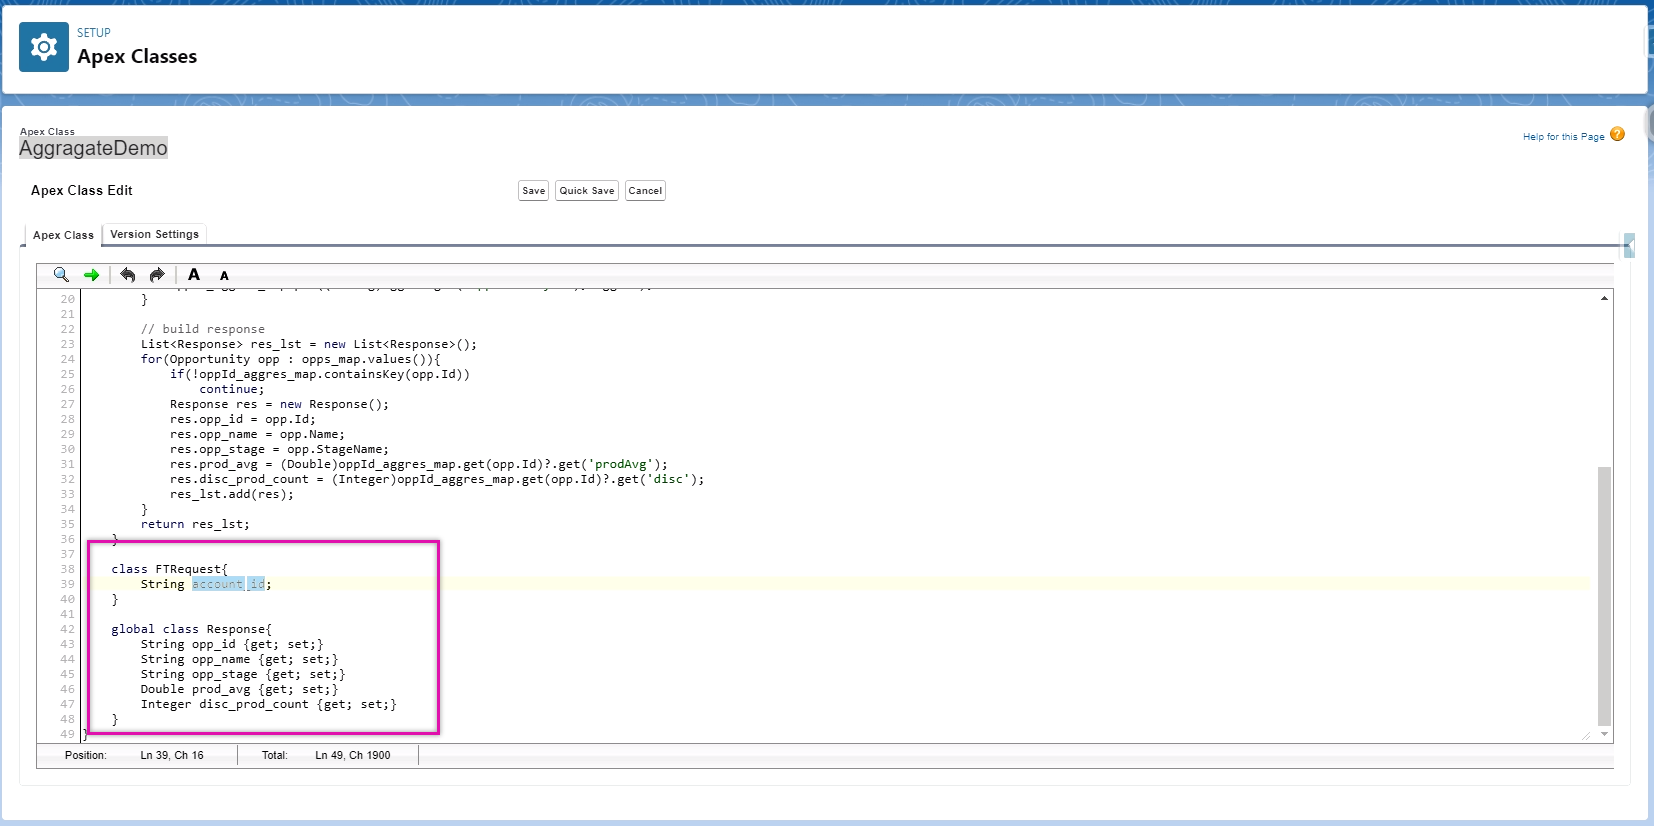
The aggregated data is created in Salesforce. Here is the detailed breakdown of the apex class used in this example:
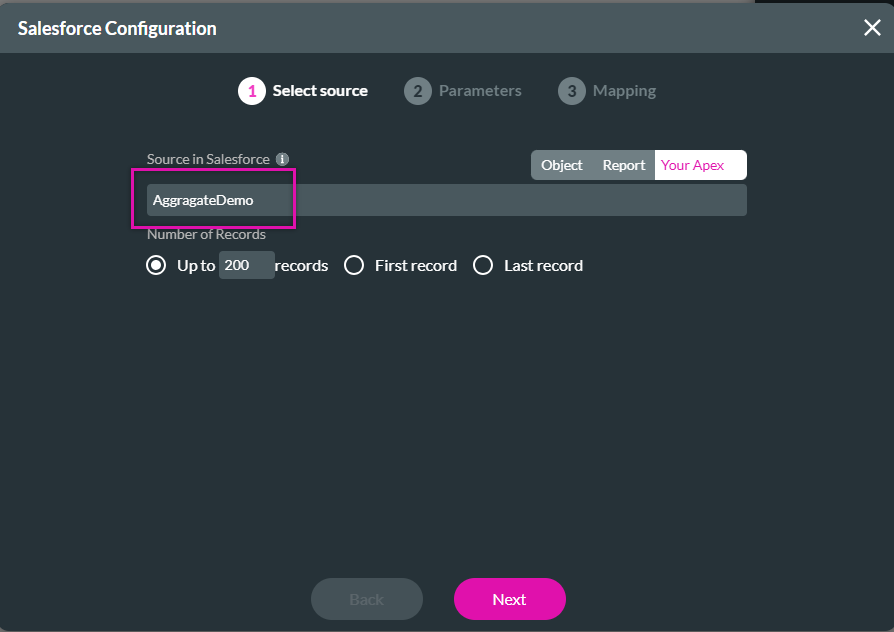
1. Copy the name of the Apex Class in Salesforce and paste the name into the Source in Salesforce field. Click Next.
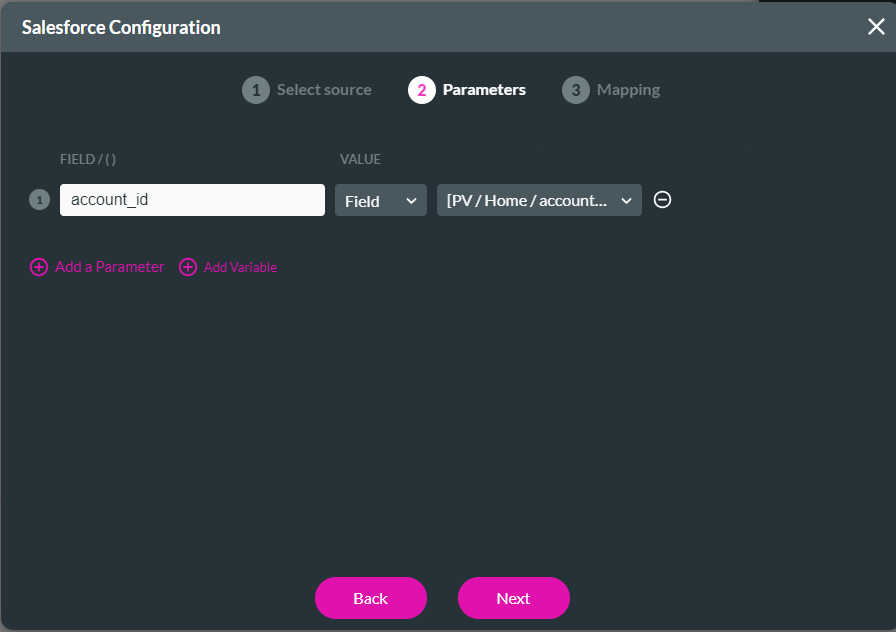
2. Using the strings from the Apex data, configure the parameters of your table. For example, the account ID must equal the account ID field. Click Next.
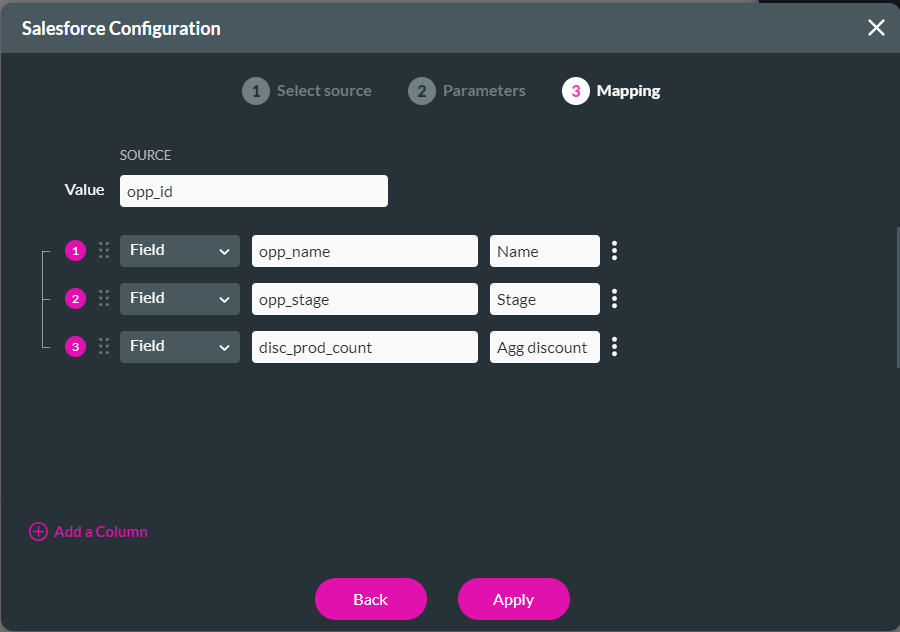
3. Insert the Source Value text. This should be copied directly from your apex to ensure the strings are identical; this also applies to each table column. Configure your column names by manually adding the data. Click Apply.
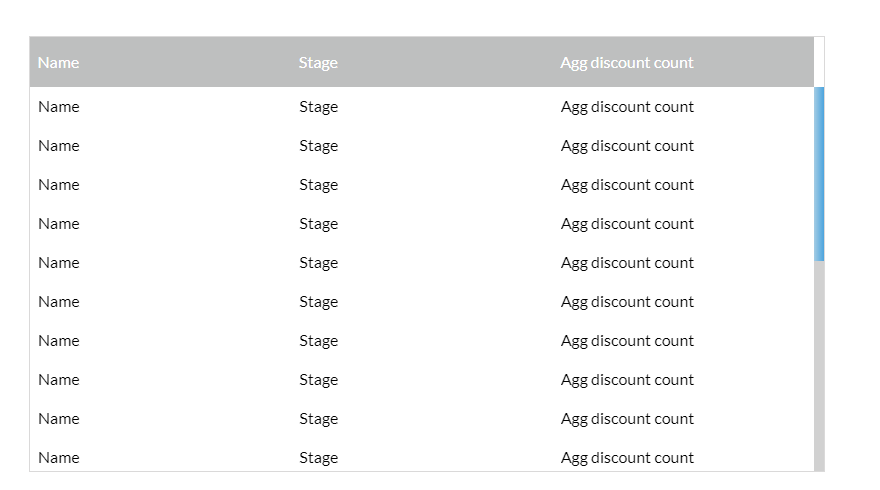
The table is inserted onto the canvas.
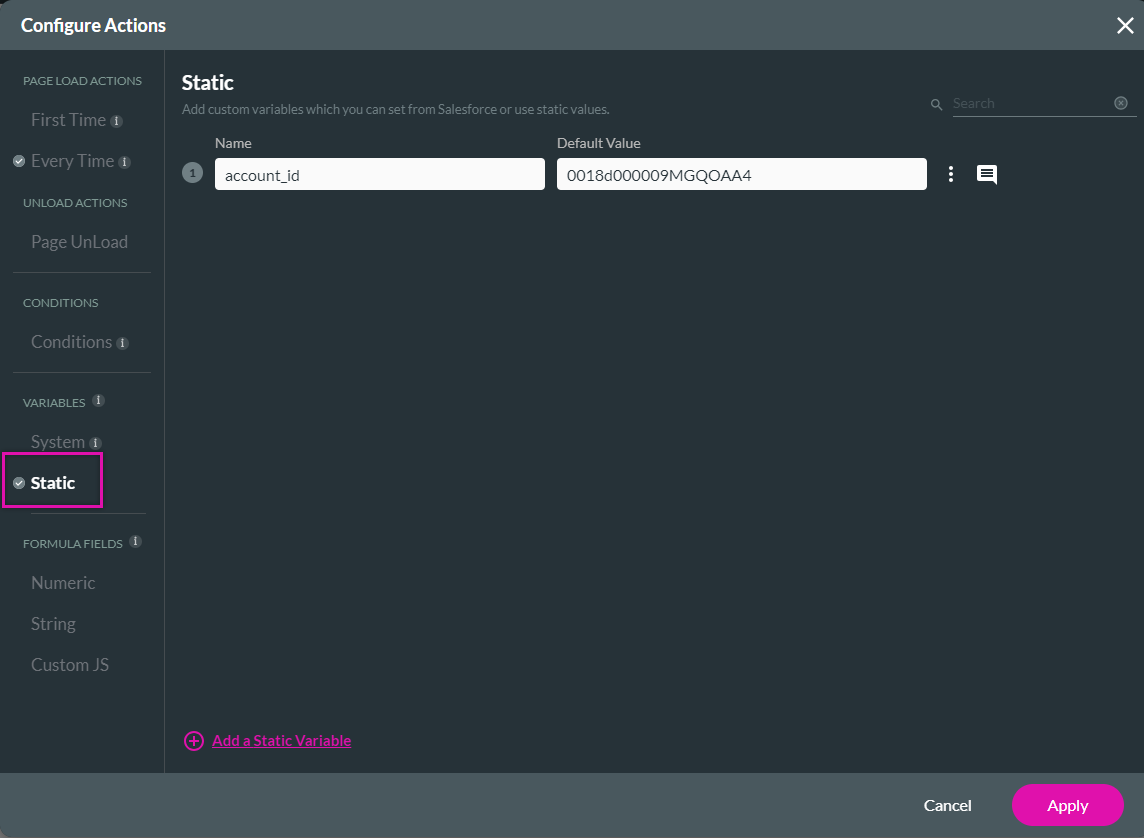
To check the configuration of the table, an account ID was copied from Salesforce and used to populate a static variable. To complete this step:
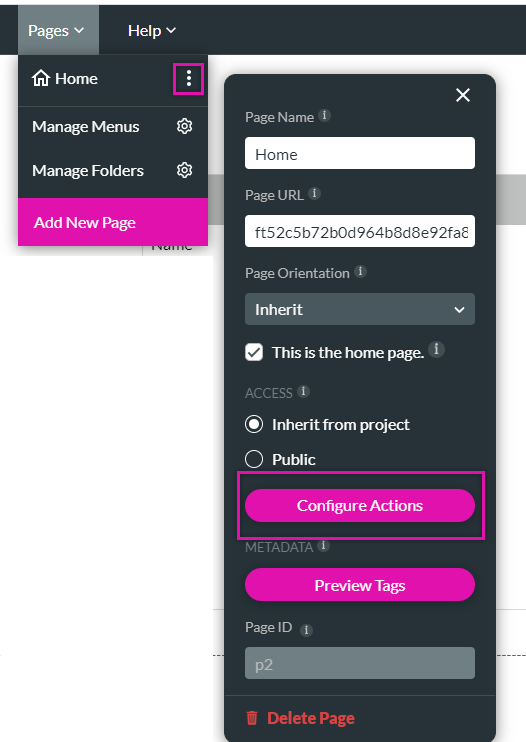
1. Open the Pages drop-down, select the kebab menu next to a project page, and click configure actions from the sub-menu.
2. Click the Static Variables tab and create a static variable using the Account ID. Click Apply.
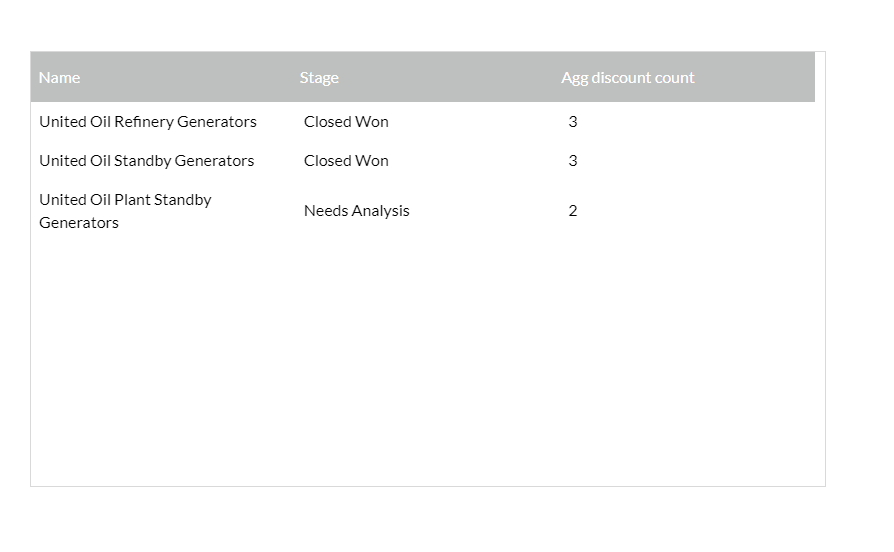
Save and Preview. The opportunity's name, the corresponding stage, and the aggregated discount count are displayed.
The aggregated data is created in Salesforce. Here is the detailed breakdown of the apex class used in this example:
- We bring opportunities for a specific account.
- Then aggregate the results to sum up the number of discounts on the opportunity line item for each opportunity.
- The data must display the number of discounts per opportunity (of the aggregated line items).
1. Copy the name of the Apex Class in Salesforce and paste the name into the Source in Salesforce field. Click Next.
2. Using the strings from the Apex data, configure the parameters of your table. For example, the account ID must equal the account ID field. Click Next.
3. Insert the Source Value text. This should be copied directly from your apex to ensure the strings are identical; this also applies to each table column. Configure your column names by manually adding the data. Click Apply.
The table is inserted onto the canvas.
To check the configuration of the table, an account ID was copied from Salesforce and used to populate a static variable. To complete this step:
1. Open the Pages drop-down, select the kebab menu next to a project page, and click configure actions from the sub-menu.
2. Click the Static Variables tab and create a static variable using the Account ID. Click Apply.
Save and Preview. The opportunity's name, the corresponding stage, and the aggregated discount count are displayed.