Debug (11 min)
Completion requirements
01 Getting Started
We will examine the options for debugging your project using Titan's debug options and the browser inspecting tools.
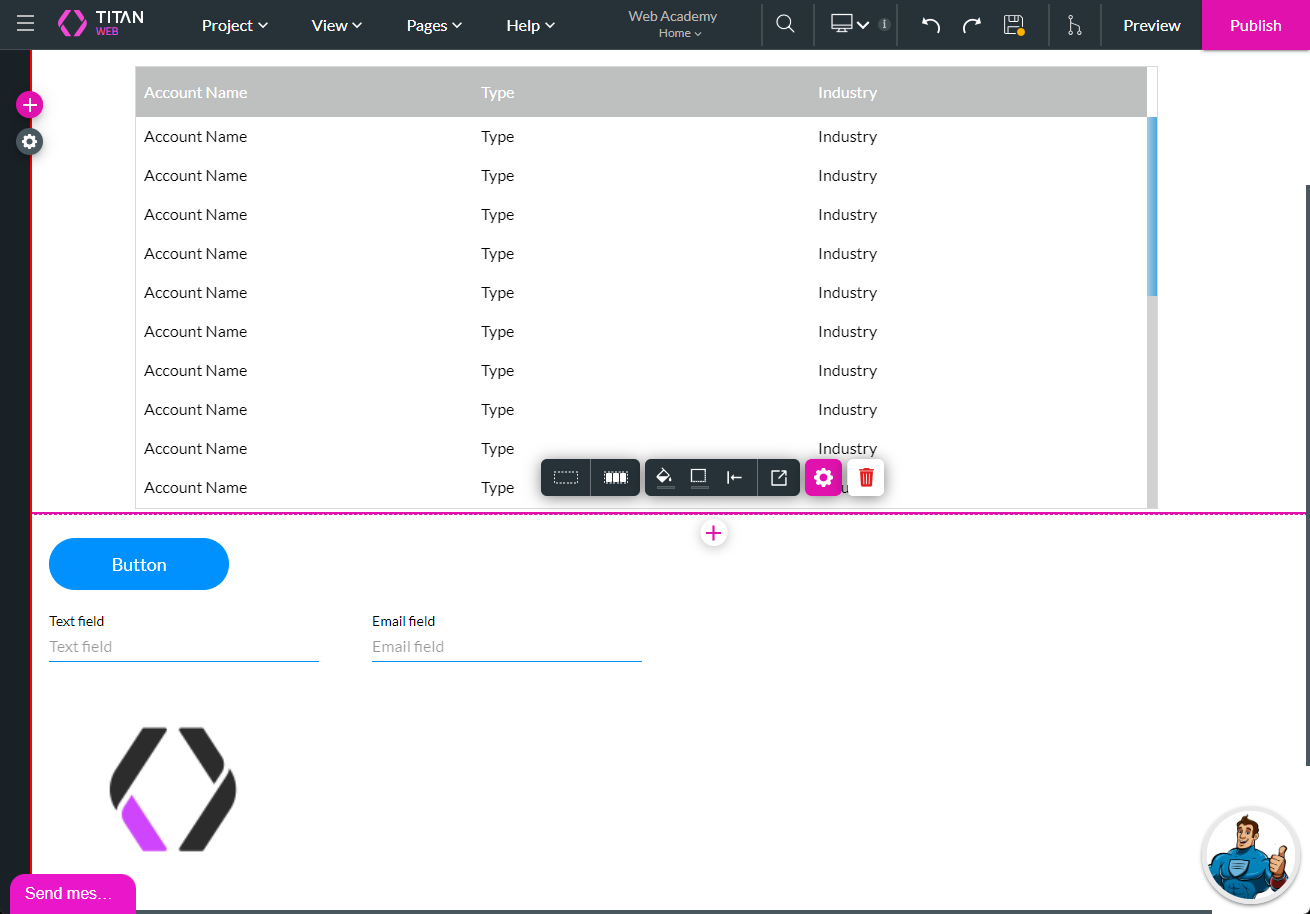
In this lesson, we have a project with the following elements:
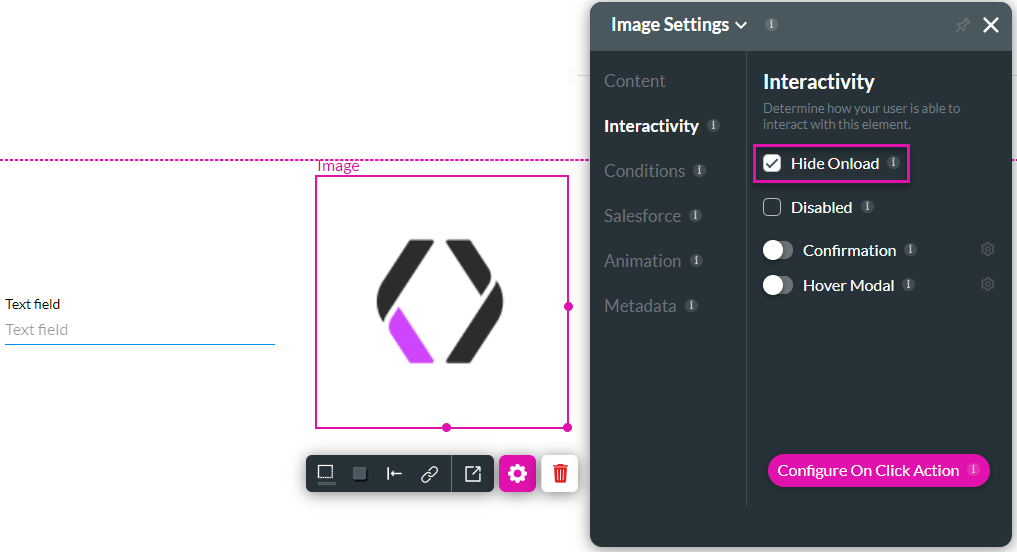
The input field and the image are hidden on load:
In this lesson, we have a project with the following elements:
- a power table that shows a list of accounts
- an input field
- an image
- a button
- an email input element
The input field and the image are hidden on load:
02 Where are the Actions and Conditions Used?
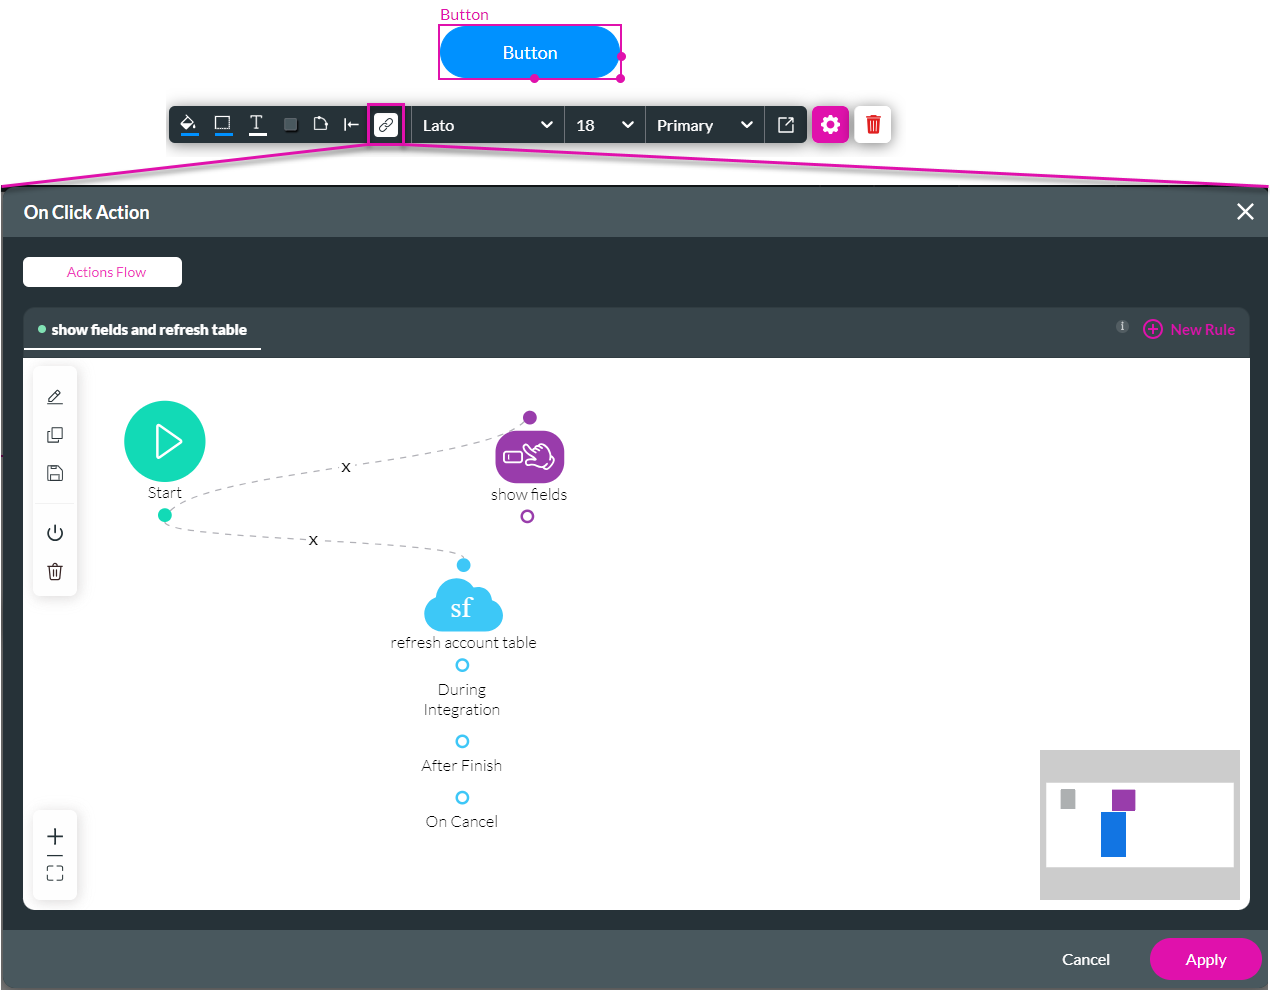
The button has the following on-click actions:
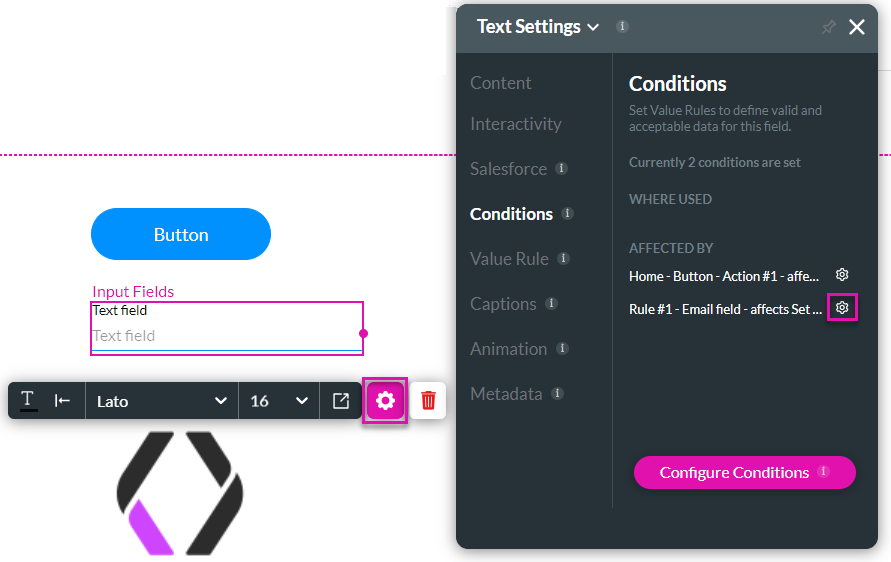
When you select the text or image and click the Gear icon, you can see the condition/s affecting that element under the Conditions option on the Settings screen. The condition shows the following:
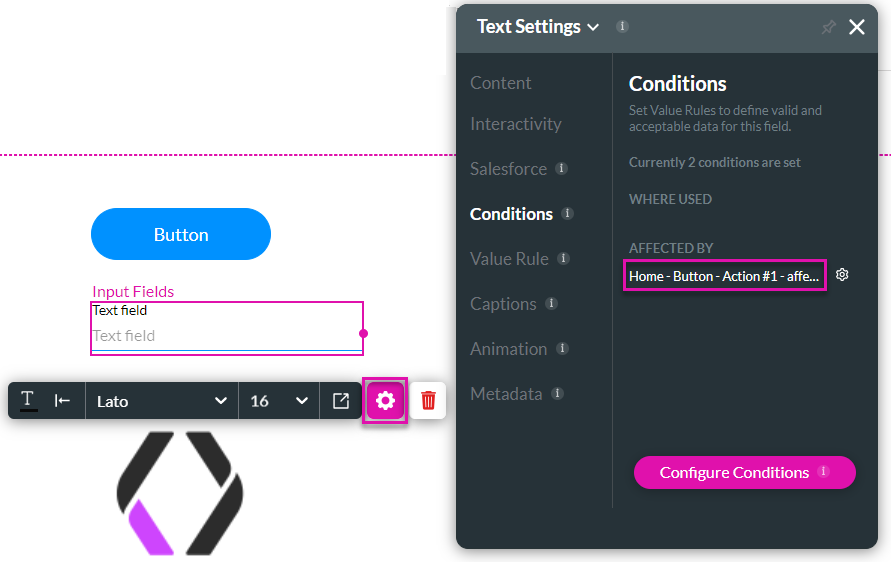
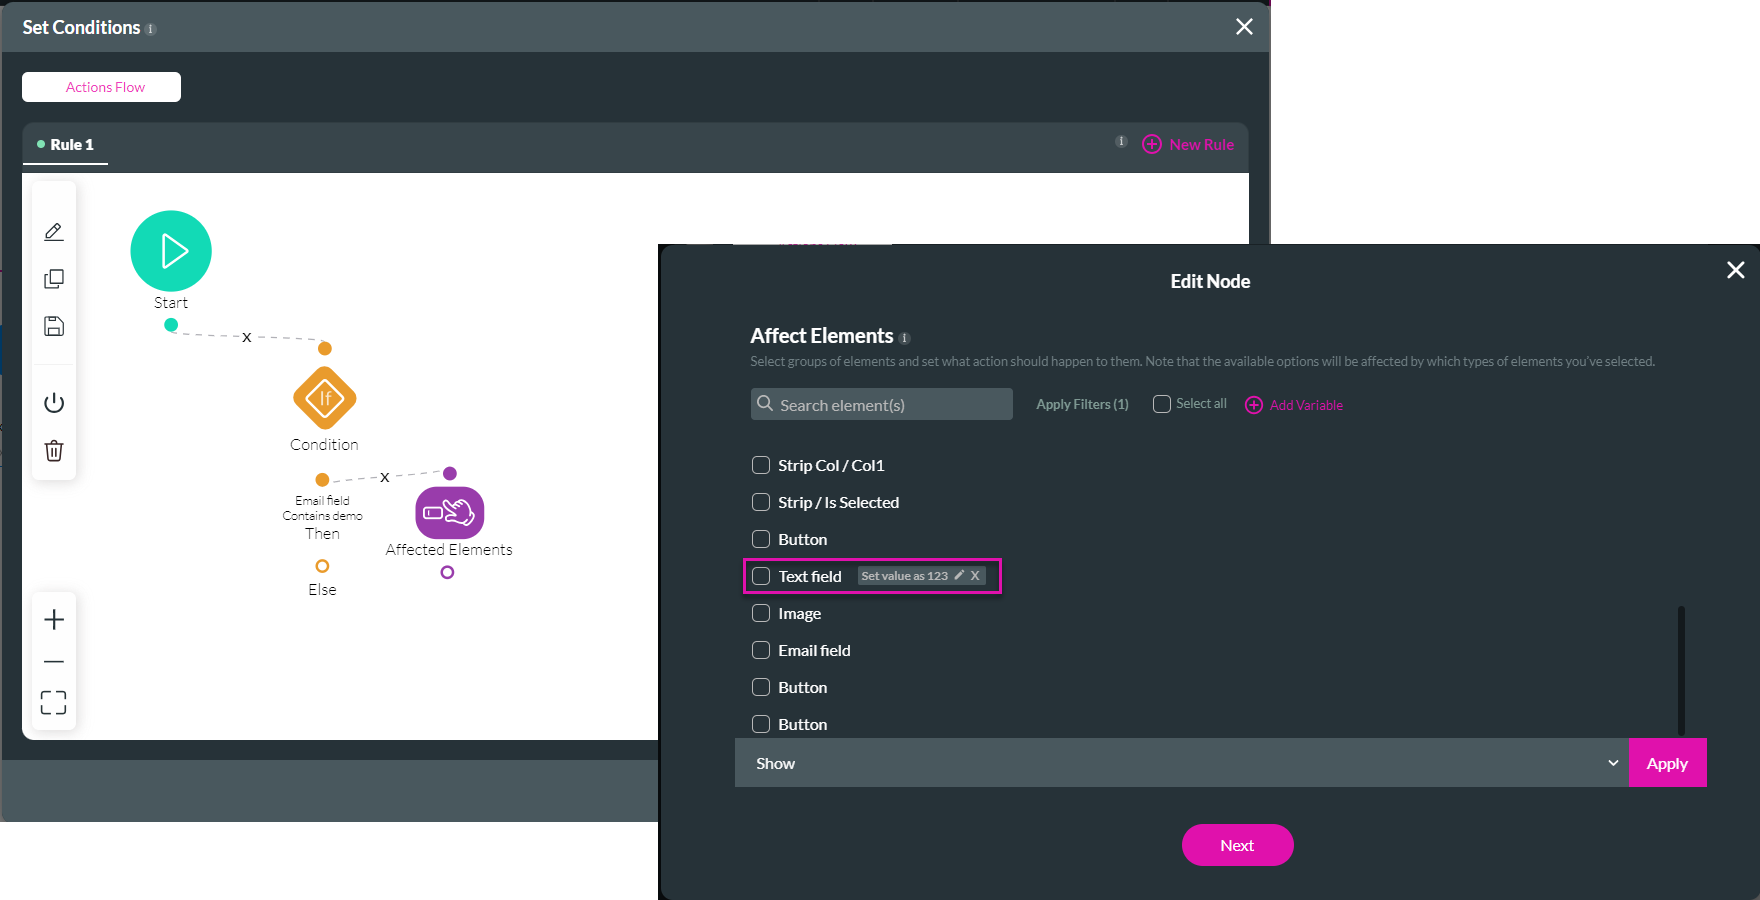
A condition was added that states that if the email field contains the word “demo,”…
… the value of the text field element is set to 123.
There is now an added condition on the text field. A tooltip is shown if you hover over the condition with the mouse pointer. This is useful when you cannot see the full name of the condition.
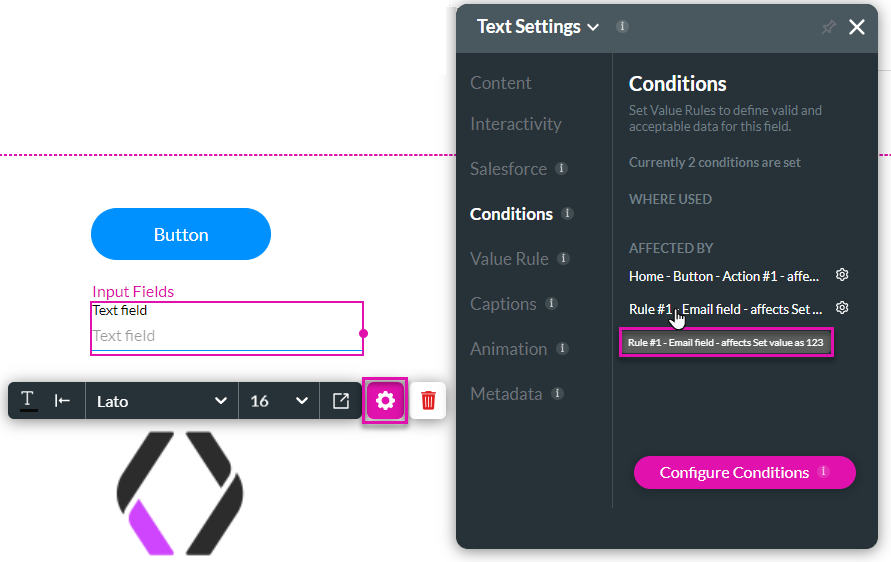
You can click the Gear icon to edit or view the condition.
- An Affect Elements node that shows the text field and the image.
- An action that refreshes the table with new information from Salesforce.
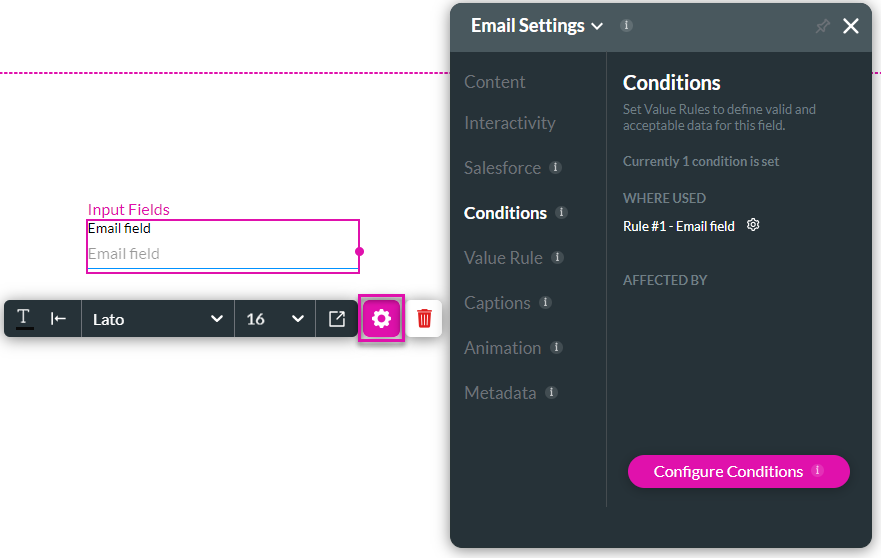
When you select the text or image and click the Gear icon, you can see the condition/s affecting that element under the Conditions option on the Settings screen. The condition shows the following:
- Home (page) - Button (element) - Action#1 (the rule that affects the element)
A condition was added that states that if the email field contains the word “demo,”…
… the value of the text field element is set to 123.
There is now an added condition on the text field. A tooltip is shown if you hover over the condition with the mouse pointer. This is useful when you cannot see the full name of the condition.
You can click the Gear icon to edit or view the condition.
03 Where are the Salesforce Integrations used?
You can view the Salesforce integrations by opening the Project Settings and clicking the Salesforce option.
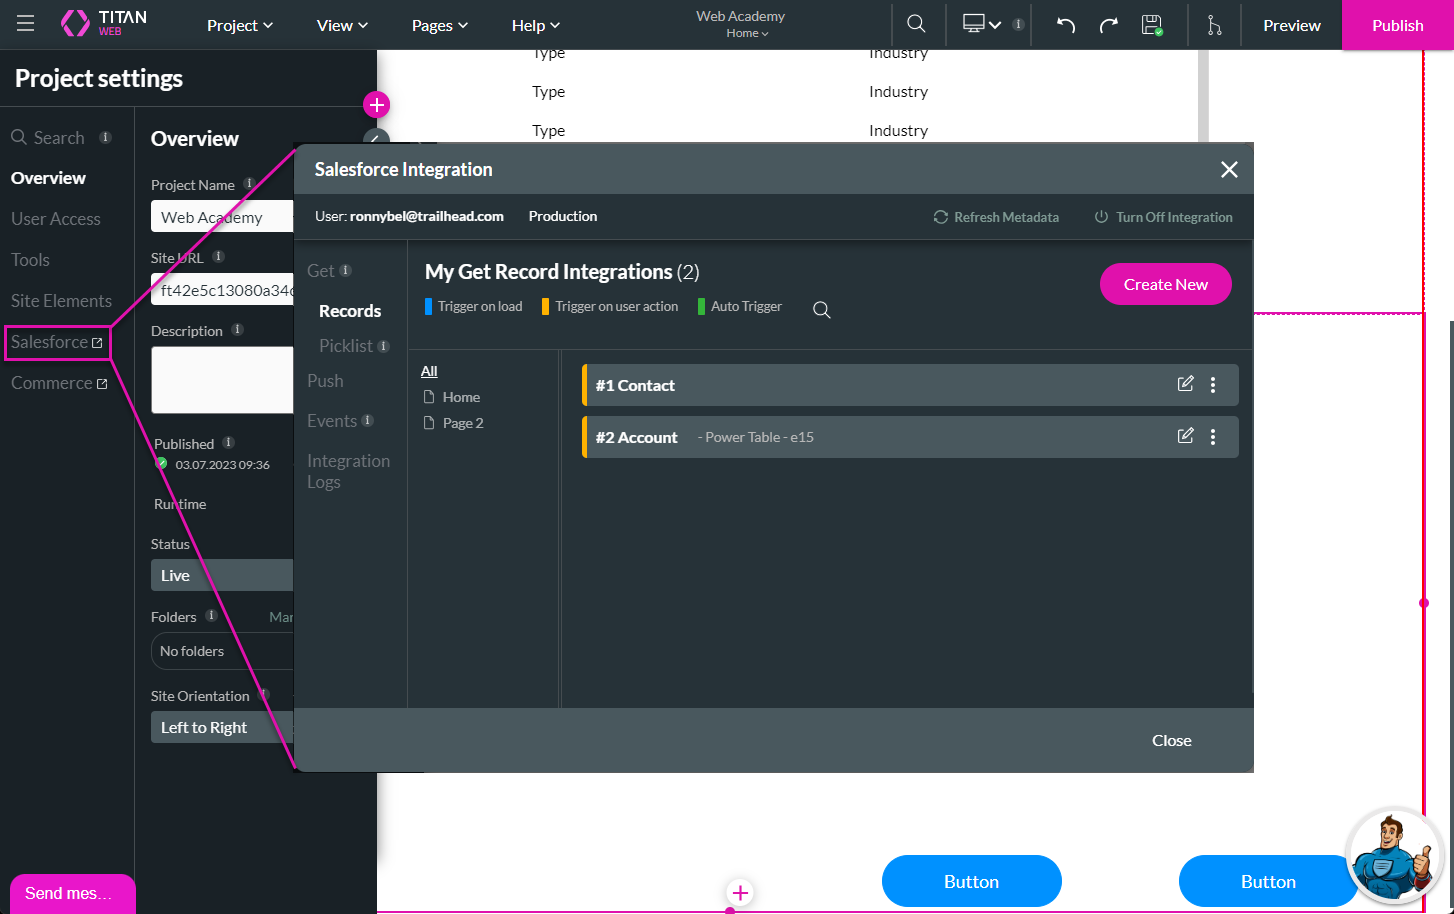
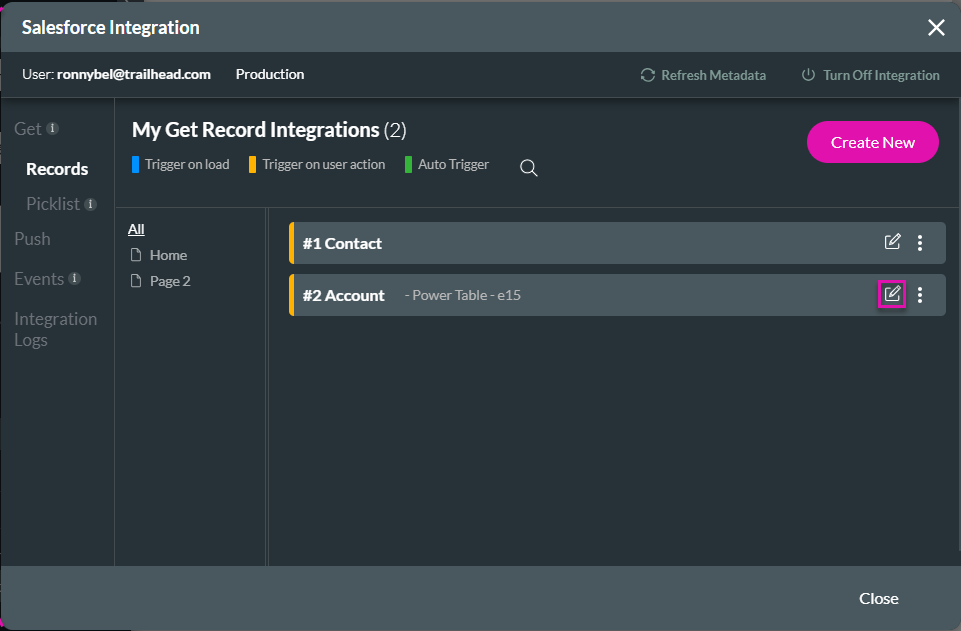
You can click the Edit icon to view the Salesforce integration.
Clicking the Where Used option on the Map Salesforce fields screen shows where Salesforce interaction is used in this project.
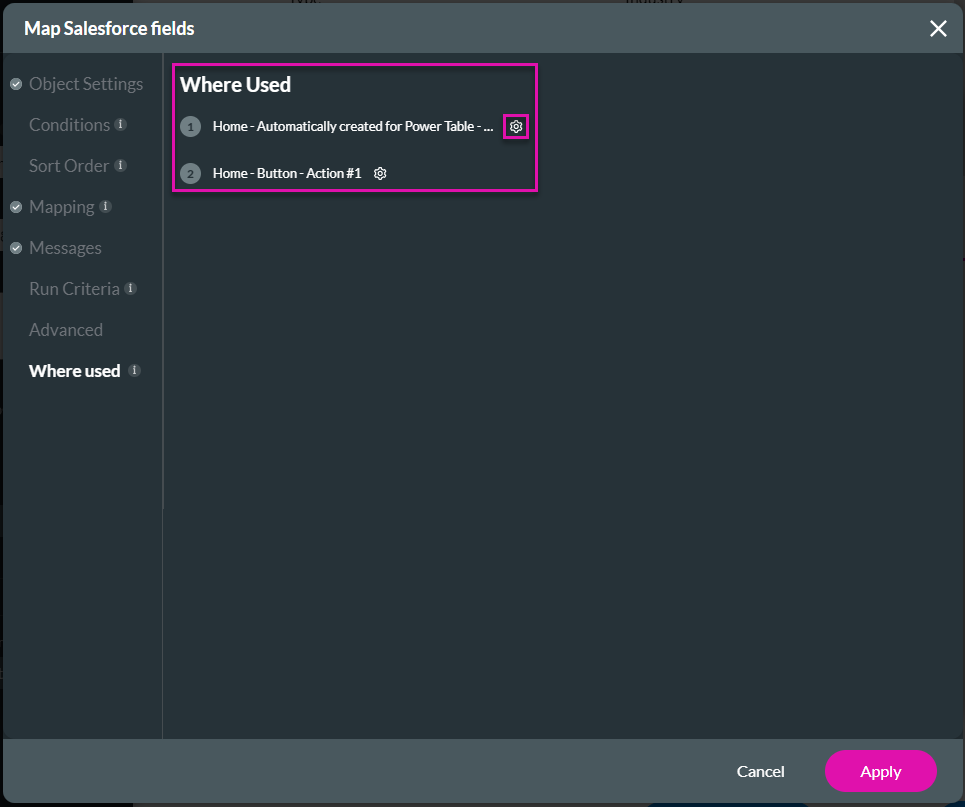
The first rule was automatically created when the power table was designed and run each time the page was loaded. The second rule is invoked from the button.
Click the Gear icon to open the Actions Flow to view and edit the Salesforce integration.
You can click the Edit icon to view the Salesforce integration.
Clicking the Where Used option on the Map Salesforce fields screen shows where Salesforce interaction is used in this project.
The first rule was automatically created when the power table was designed and run each time the page was loaded. The second rule is invoked from the button.
Click the Gear icon to open the Actions Flow to view and edit the Salesforce integration.
04 How do you Debug in the Preview Mode?
- Use the Console Tab
- Use the Network Tab
- Use the Payload Tab
05 Use the Console Tab
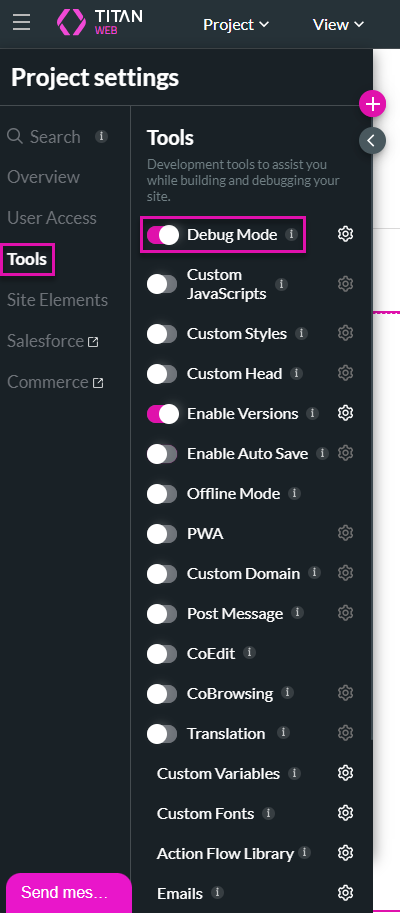
If the Debug Mode is not enabled, you will not see any feedback on the Console tab in the browser. This functionality is not available on published pages.
1. Ensure the Debug Mode is enabled on the Project Settings.
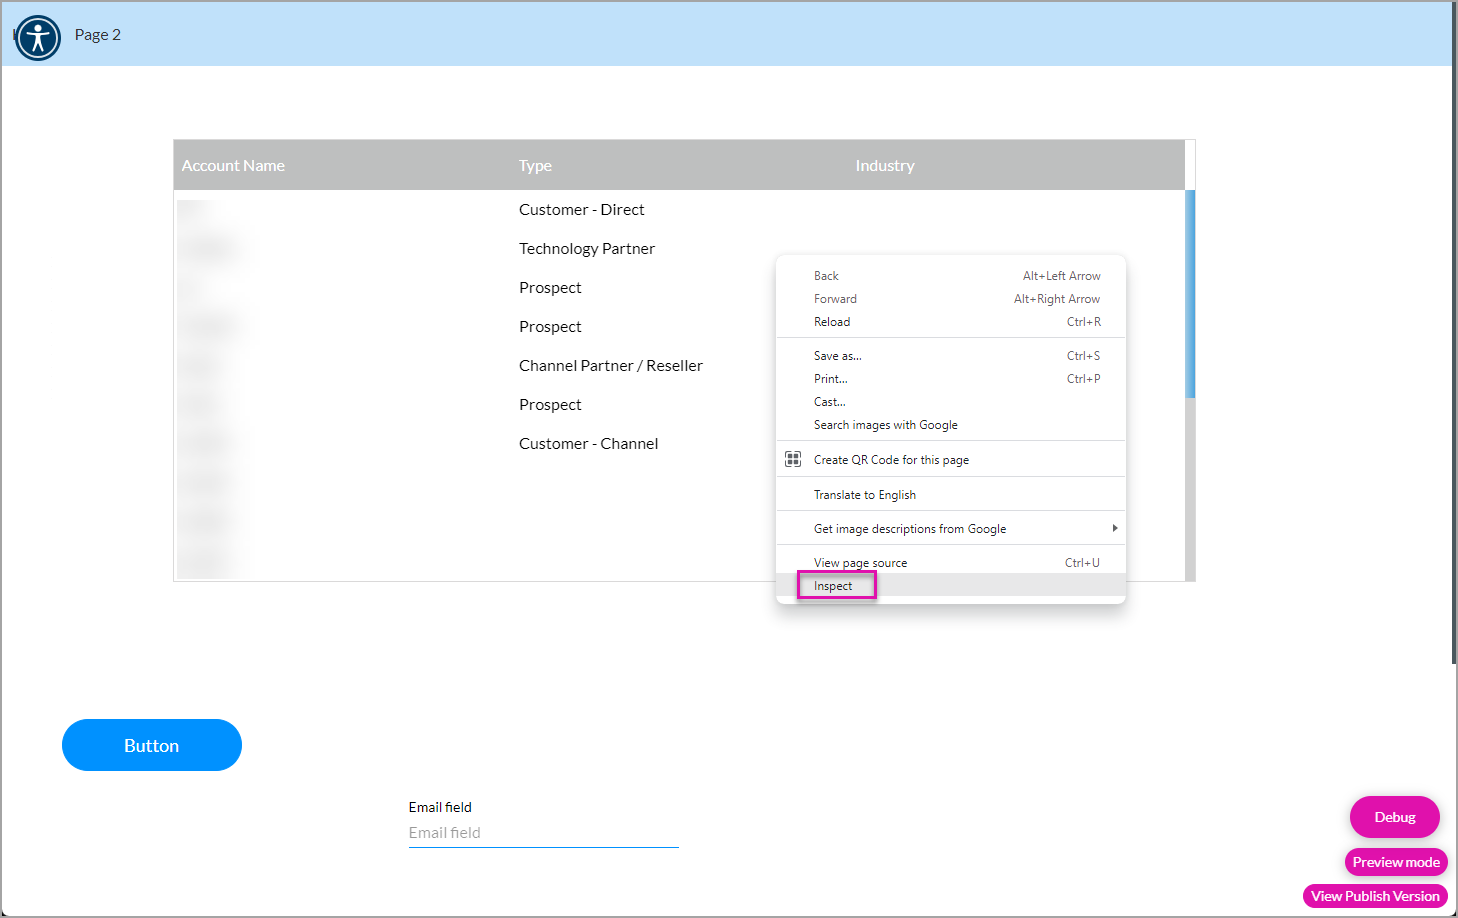
2. Save and Preview the projects.
3. On your web browser, right-click and click the Inspect option.
4. Open the Console tab and refresh the page. You will see the actions that ran.
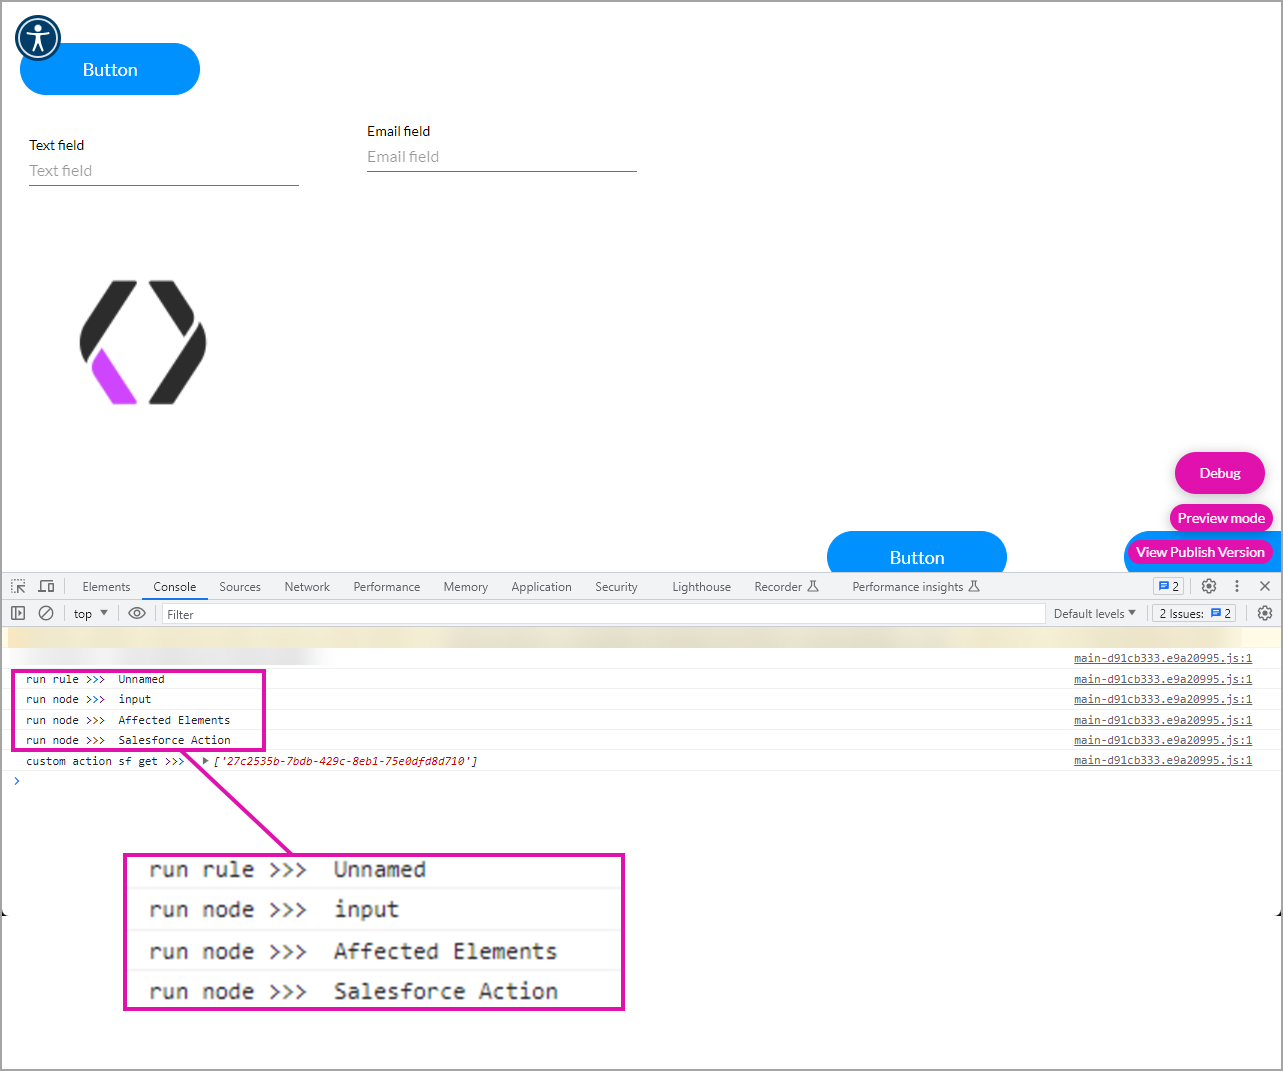
You will see that the actions have very generic names. To make identification easier, make sure that you give your rules, conditions, actions, and so on descriptive names.
The descriptive names are now shown when the page is refreshed:
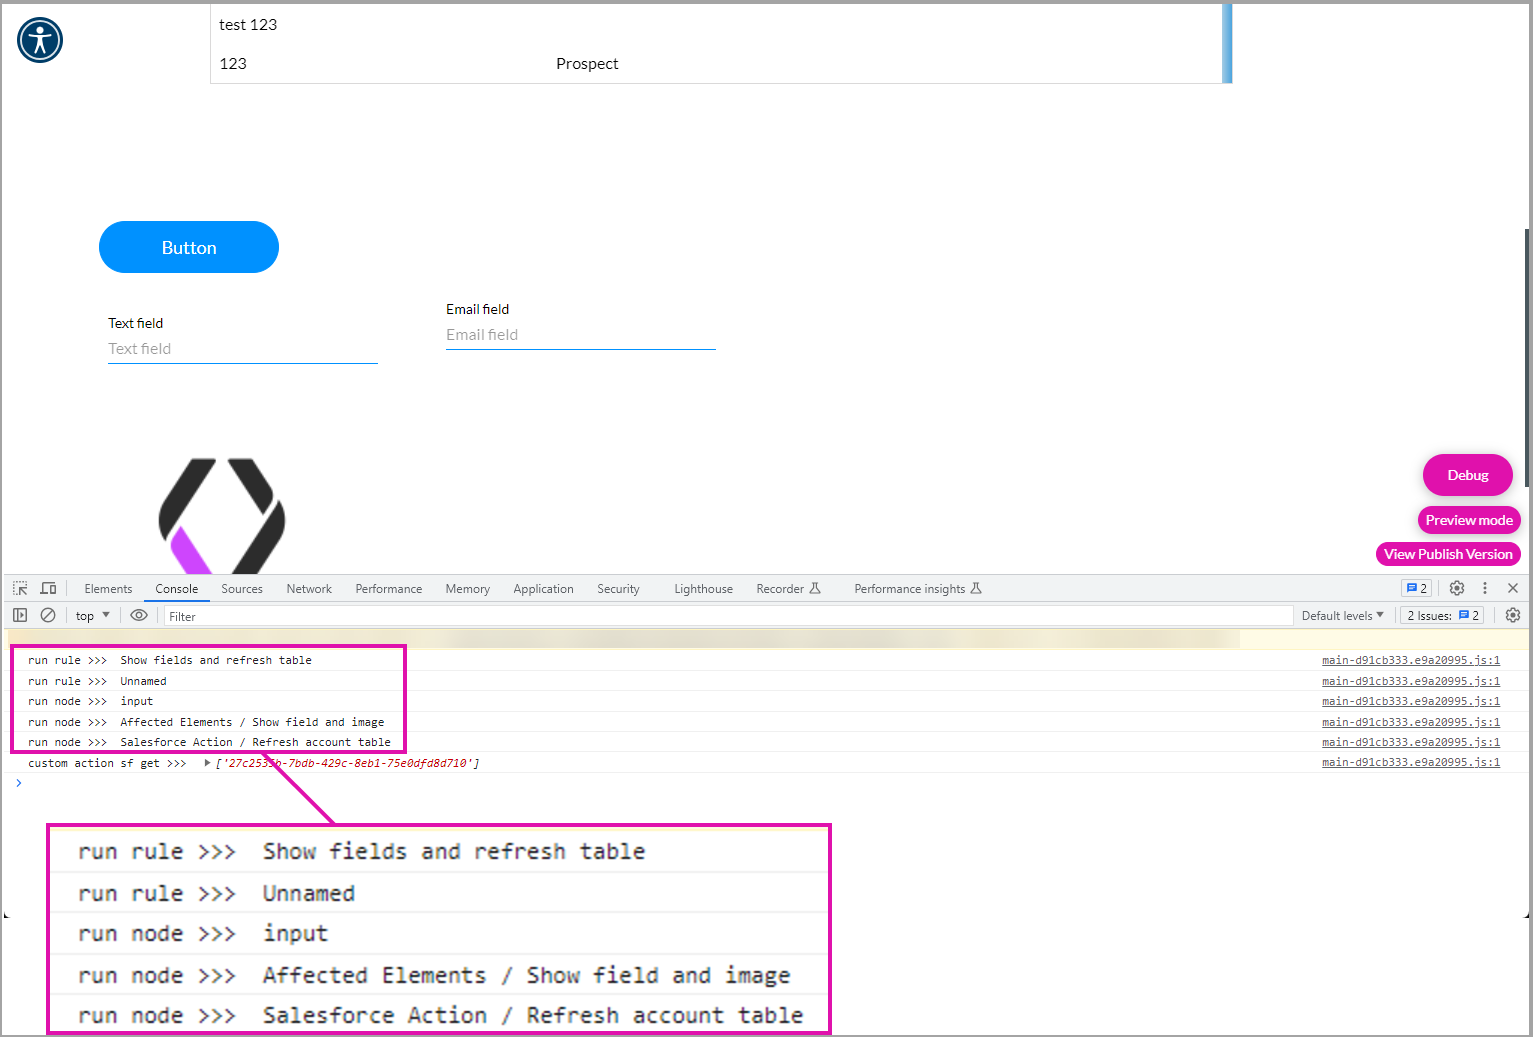
You will also see the ID on the custom action Salesforce Get that you can use to find the specific element in Titan.
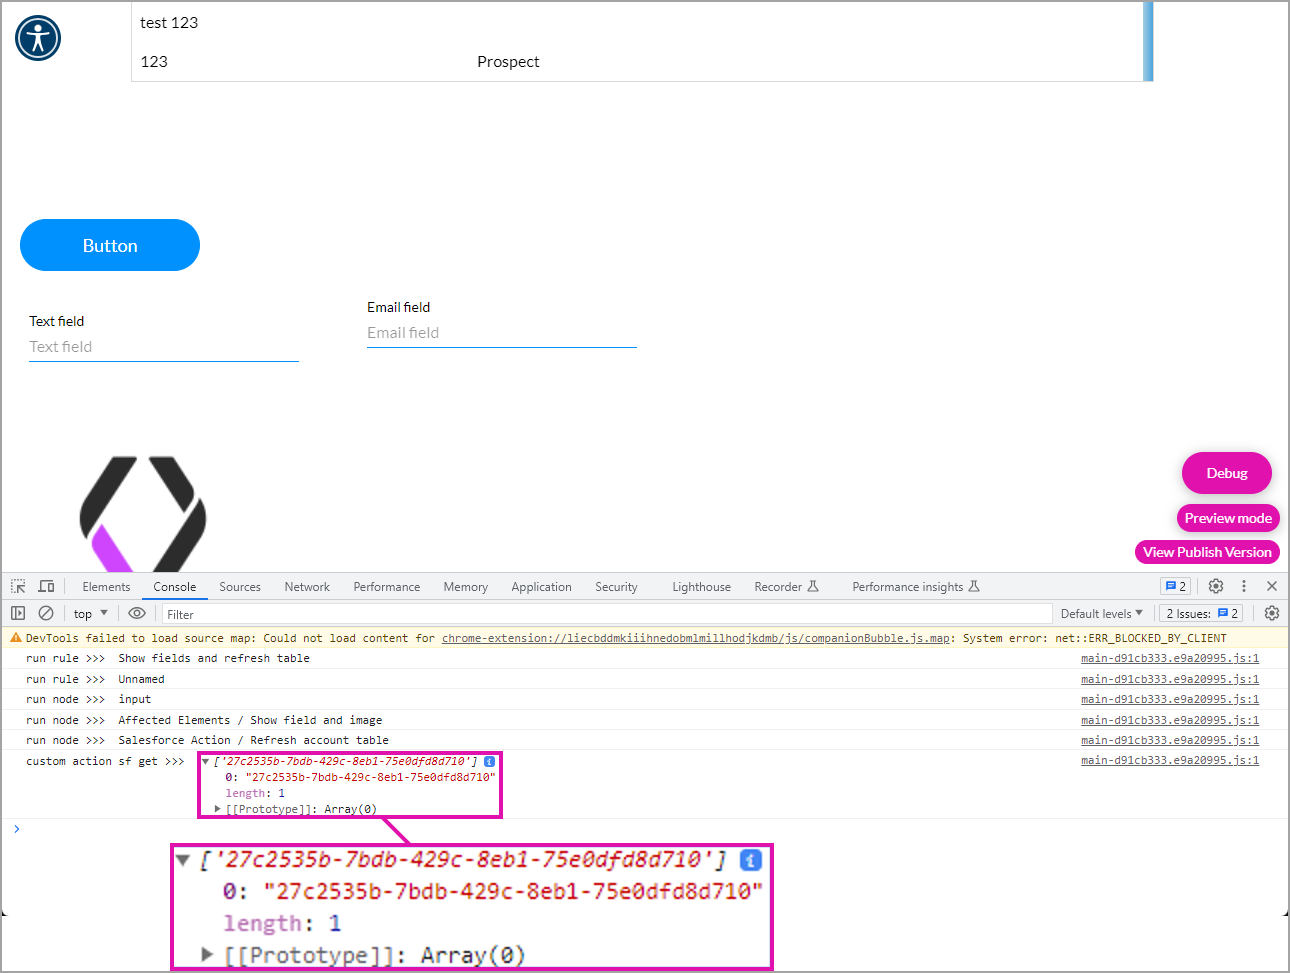
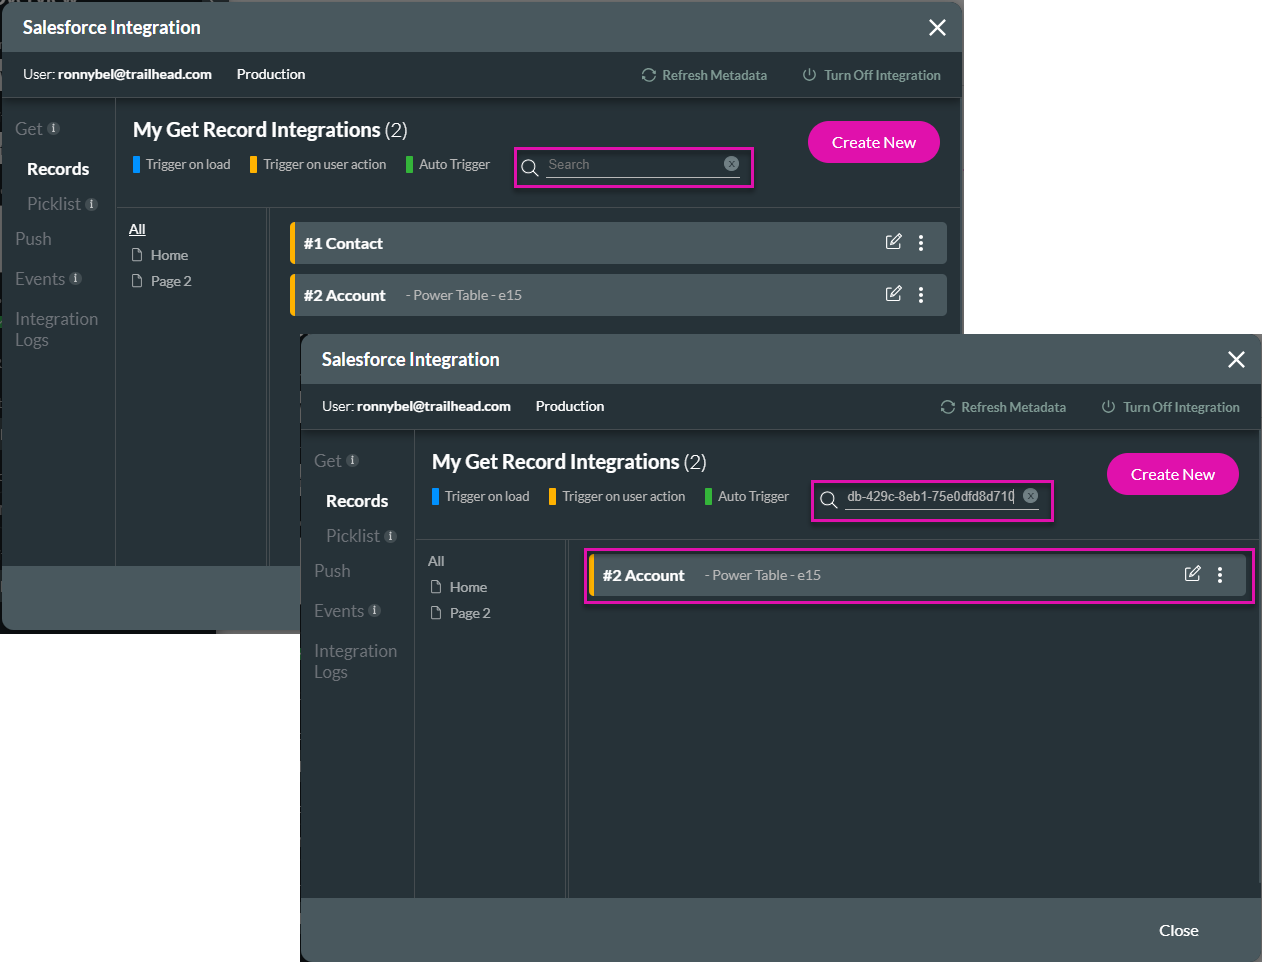
1. Copy the ID and open the Salesforce Integrations under the Project Settings.
2. Paste the ID. The associated Salesforce action is shown. This is especially helpful on a project with many Get integrations.
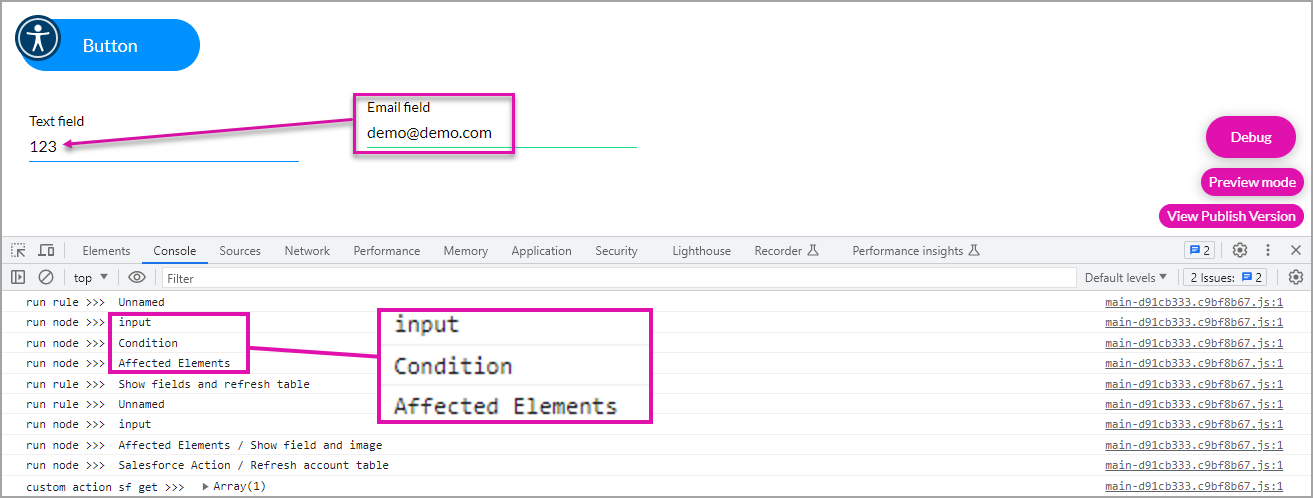
3. If an email address containing the word “demo” is added, the text field is populated with “123” according to the condition. You can see this on the Console tab:
1. Ensure the Debug Mode is enabled on the Project Settings.
2. Save and Preview the projects.
3. On your web browser, right-click and click the Inspect option.
4. Open the Console tab and refresh the page. You will see the actions that ran.
You will see that the actions have very generic names. To make identification easier, make sure that you give your rules, conditions, actions, and so on descriptive names.
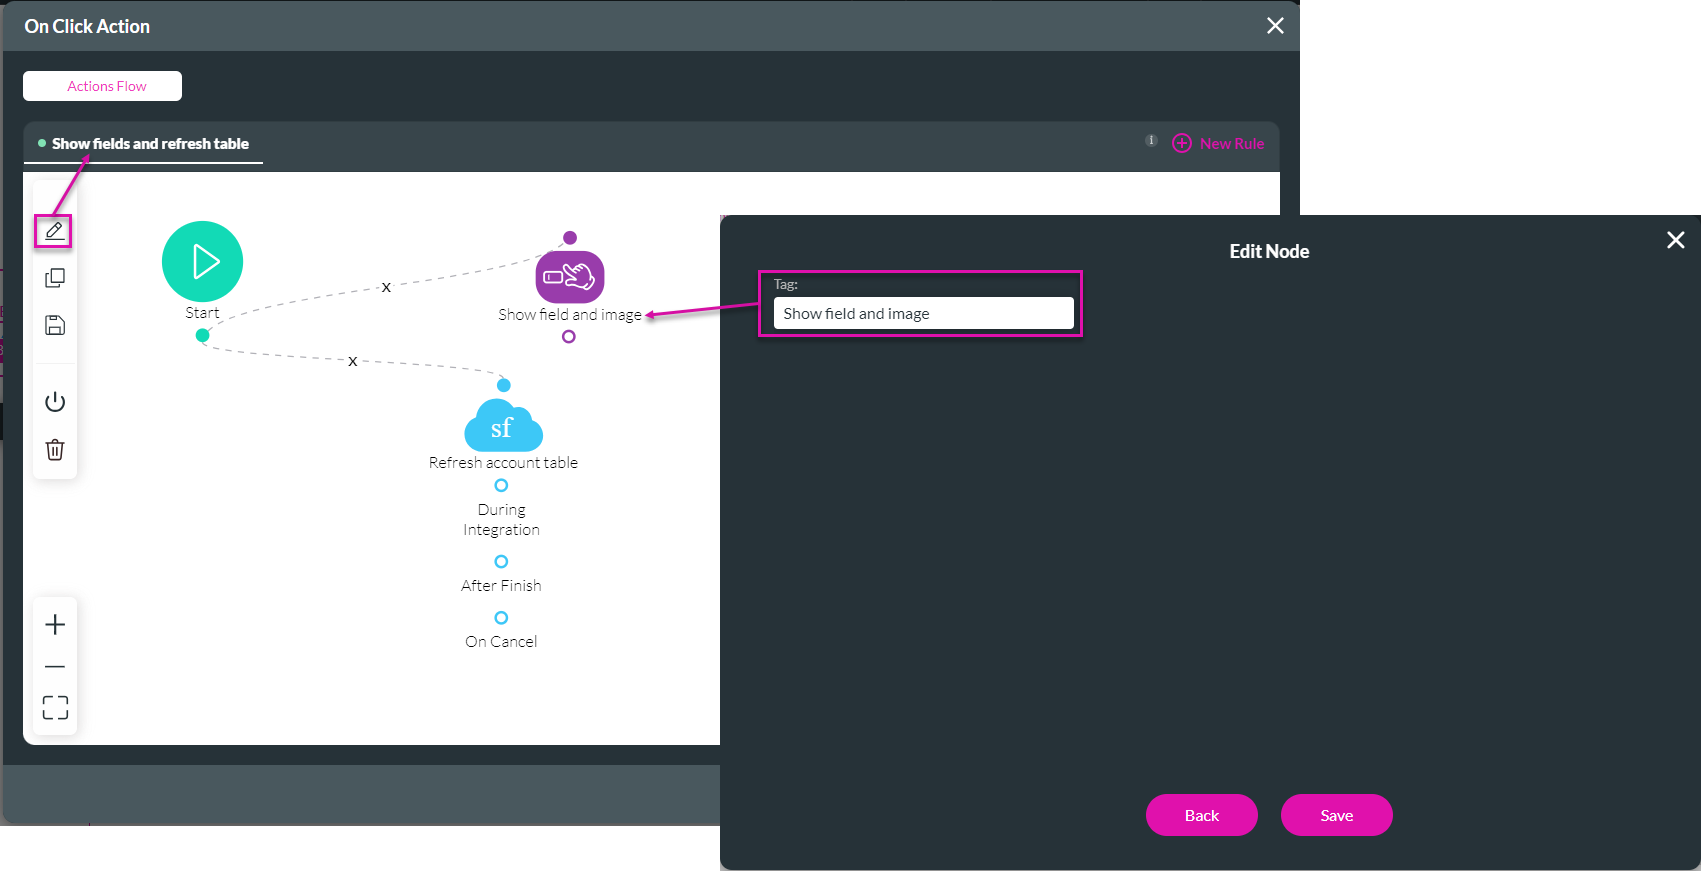
- Edit the rule name
- Give a descriptive tag
The descriptive names are now shown when the page is refreshed:
You will also see the ID on the custom action Salesforce Get that you can use to find the specific element in Titan.
1. Copy the ID and open the Salesforce Integrations under the Project Settings.
2. Paste the ID. The associated Salesforce action is shown. This is especially helpful on a project with many Get integrations.
3. If an email address containing the word “demo” is added, the text field is populated with “123” according to the condition. You can see this on the Console tab:
06 Use the Network Tab
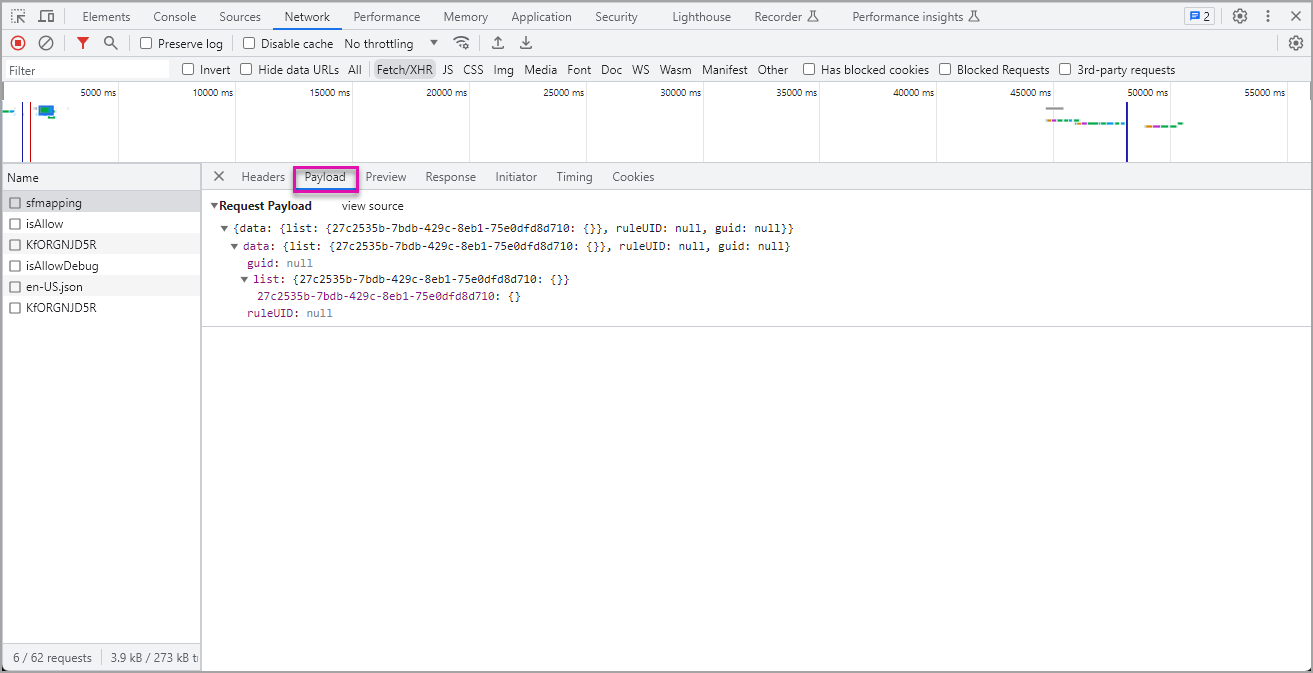
1. Click the Network tab and ensure the Fetch/XH tab is open.
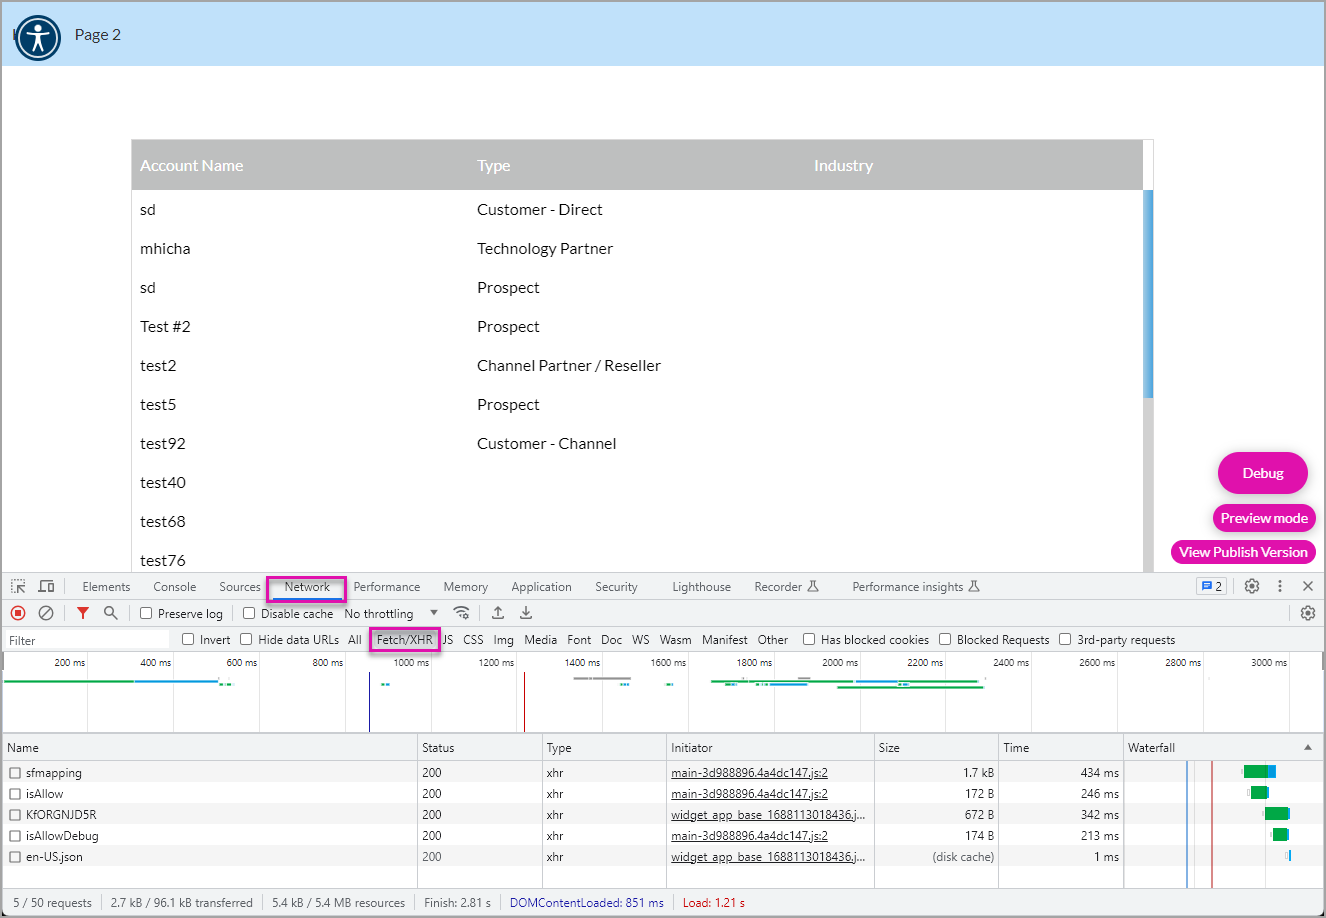
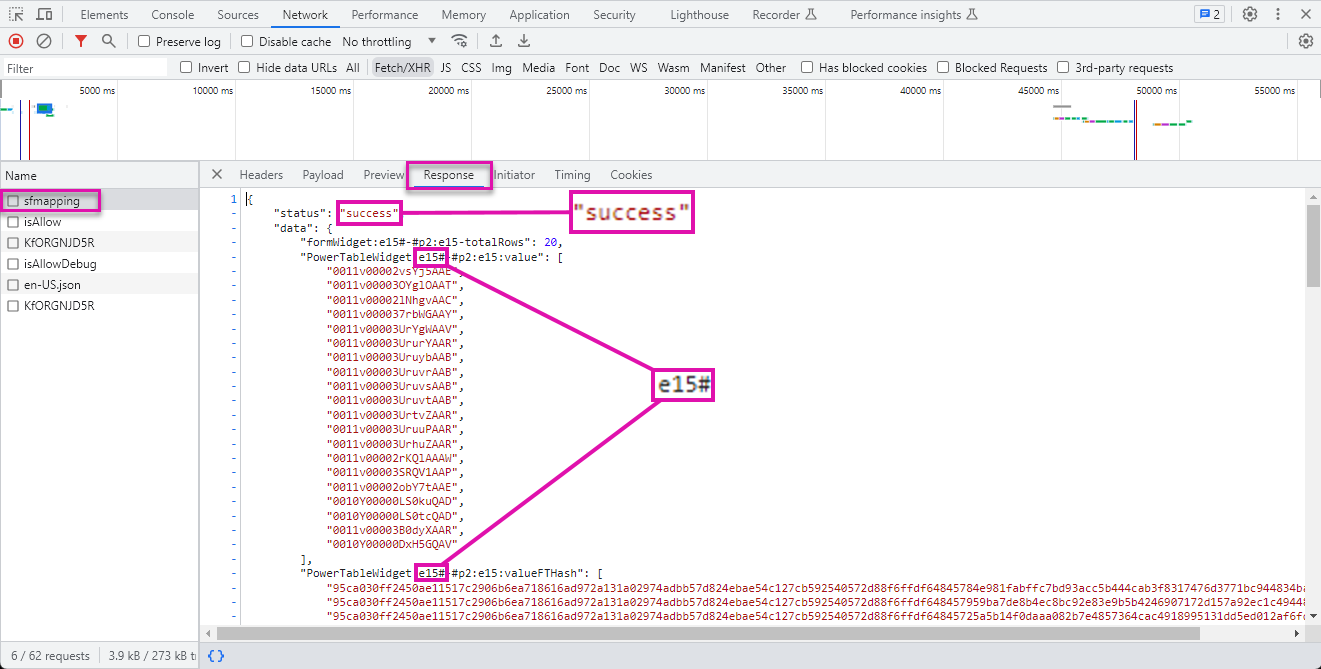
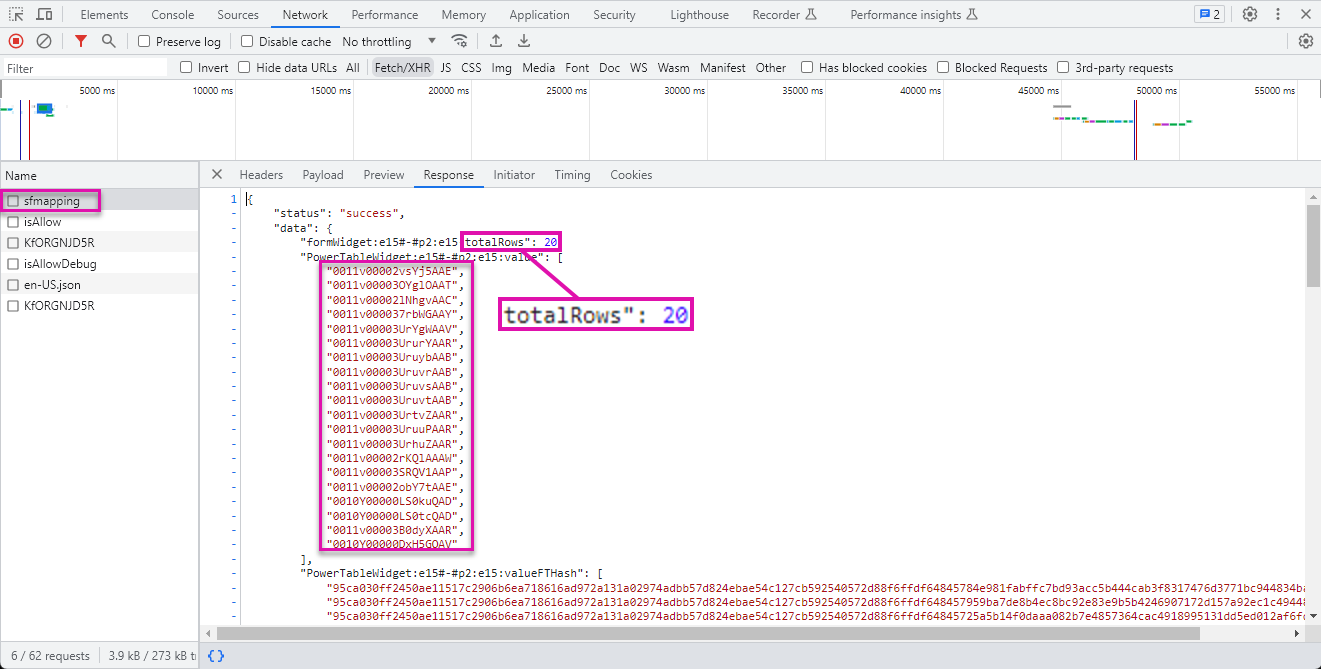
2. Click the sfmapping option. This shows the integration with Salesforce.
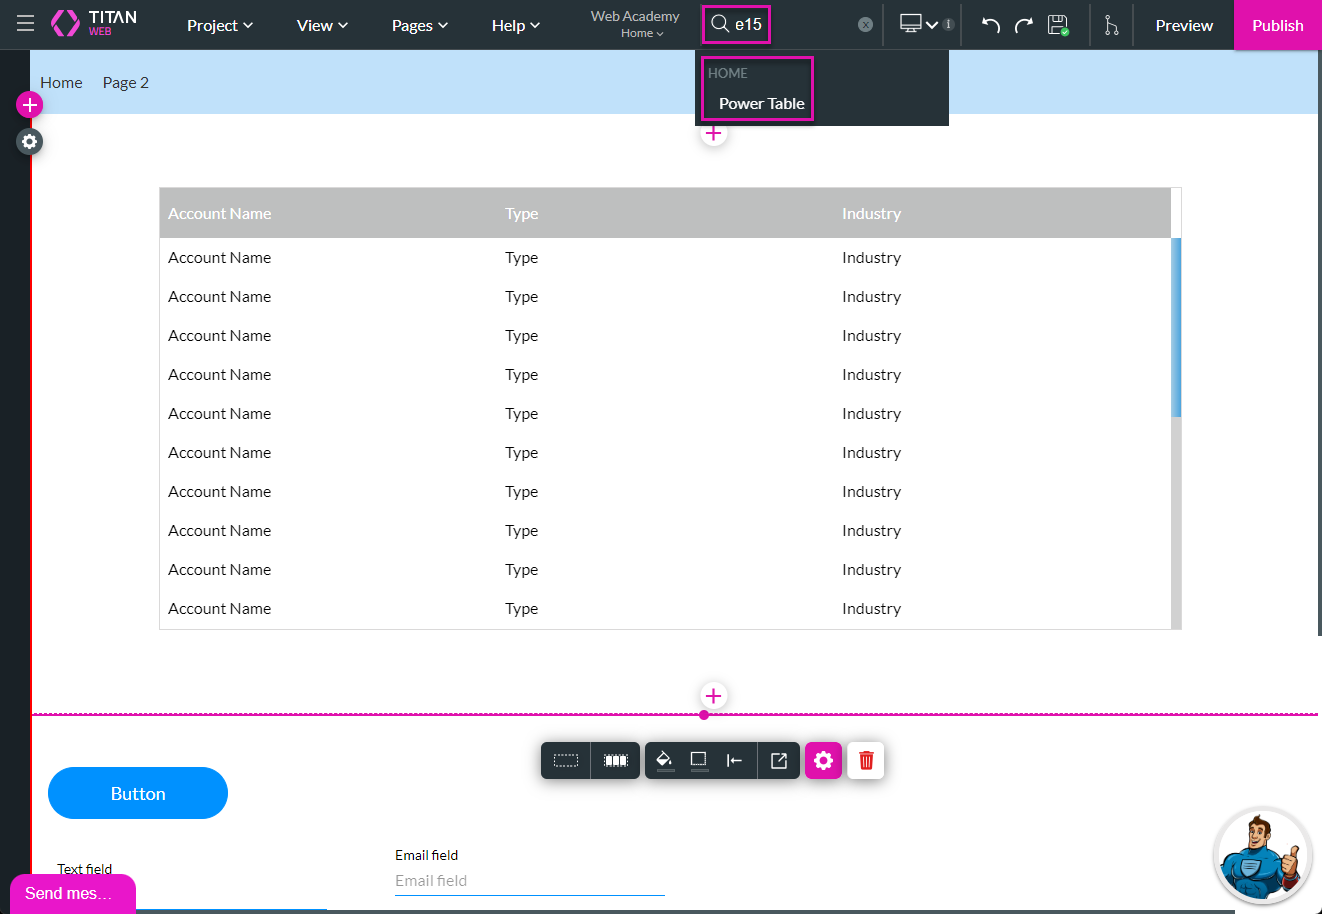
3. Copy the power table ID and paste it into the Search field in the Titan Web builder. It will show you where the power table with that ID is.
You will also see the contact IDs that the query returned to the power table.
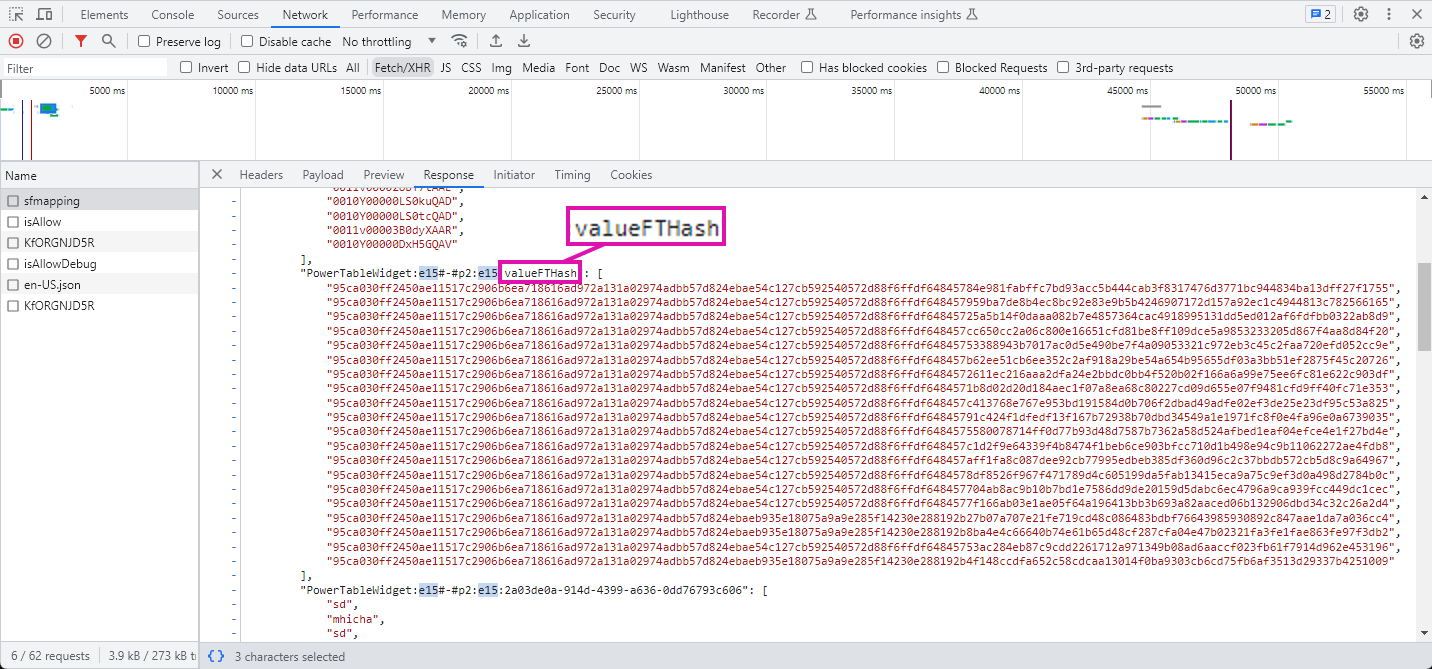
If you scroll down, you will see the hash value stored in a hidden column.
When you scroll down further, you will see the list of account names that the query returned.
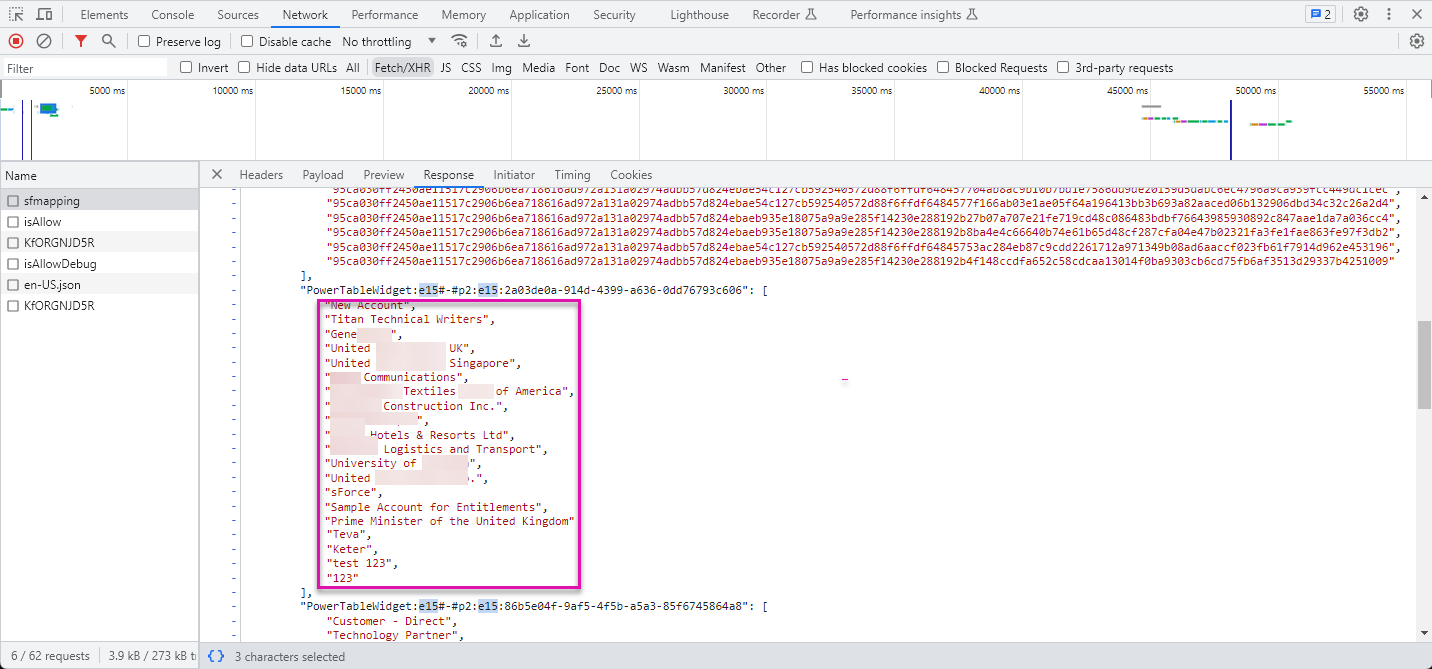
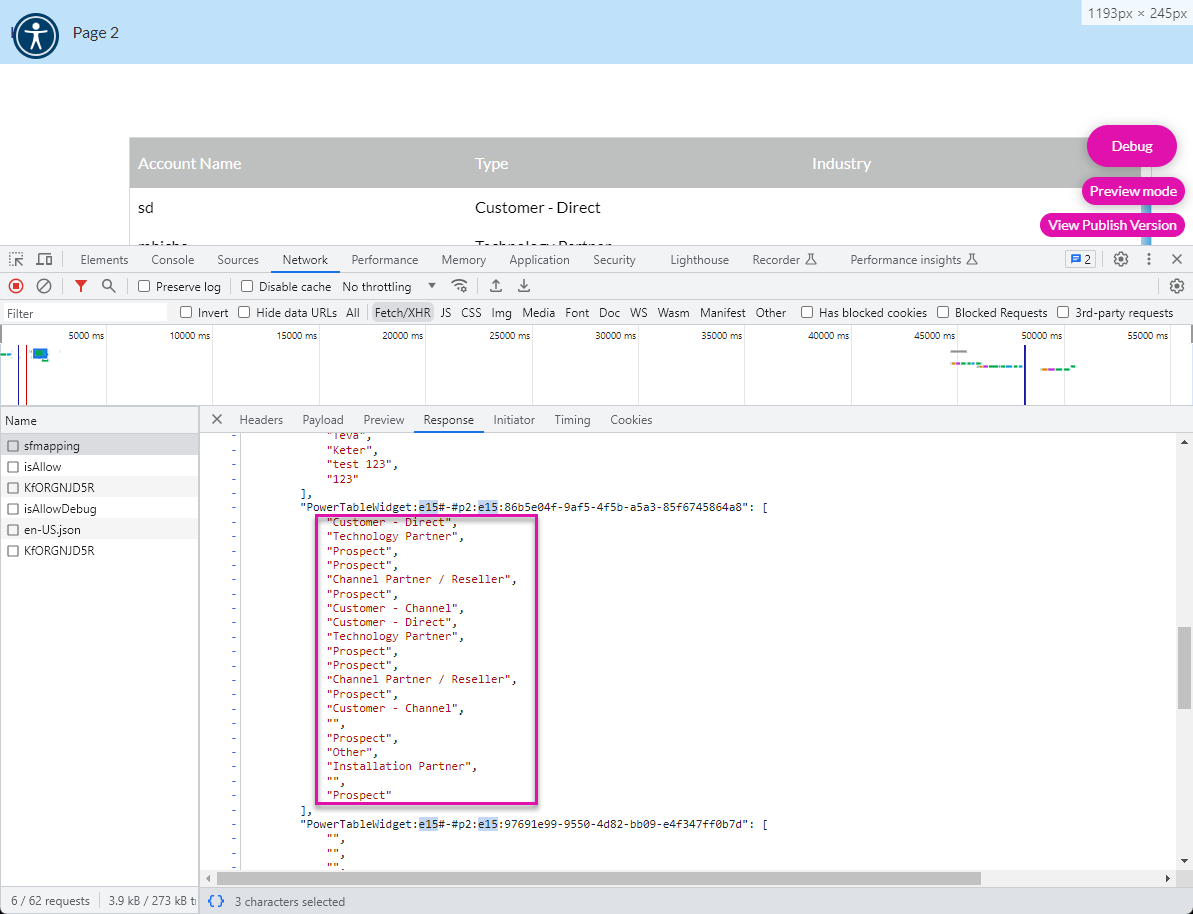
Below are the account names, where you will see the account type.
2. Click the sfmapping option. This shows the integration with Salesforce.
- If the status is “success” on the Response tab, the data was pushed to or retrieved from Salesforce as expected.
- The power table ID is shown, which is helpful if you have multiple power tables in the project.
3. Copy the power table ID and paste it into the Search field in the Titan Web builder. It will show you where the power table with that ID is.
You will also see the contact IDs that the query returned to the power table.
If you scroll down, you will see the hash value stored in a hidden column.
When you scroll down further, you will see the list of account names that the query returned.
Below are the account names, where you will see the account type.
07 Use the Payload Tab
1. Open the Payload tab and expand the lists. You can see any parameters that you configured for the query if there are any.