Table (12 min)
01 Getting Started
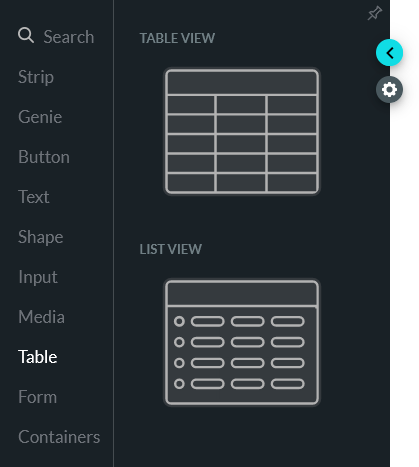
02 Tables
There are currently two tables available in Form. As Table View is the more robust option, we will use it for demonstration.
03 Table Configuration
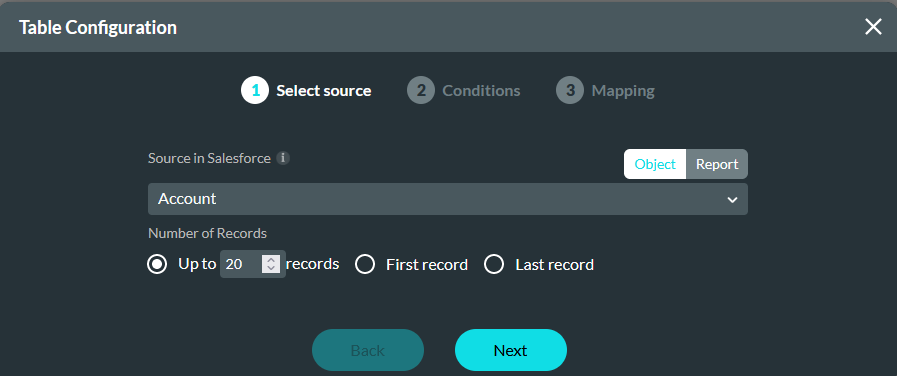
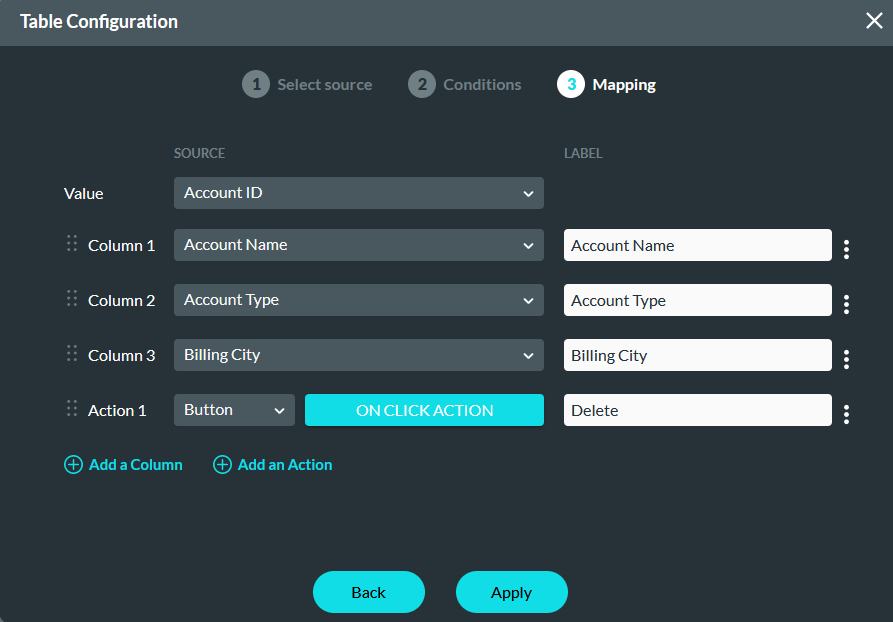
When adding a Table to your canvas, the Table Configuration window displays. This window contains steps that allows you to configure what data will be displayed in your table.
In Step 1, you will select the source. This can either be a Object or a Report. For example, the Account Object in Salesforce. You can limit the amount of records using the provided fields.
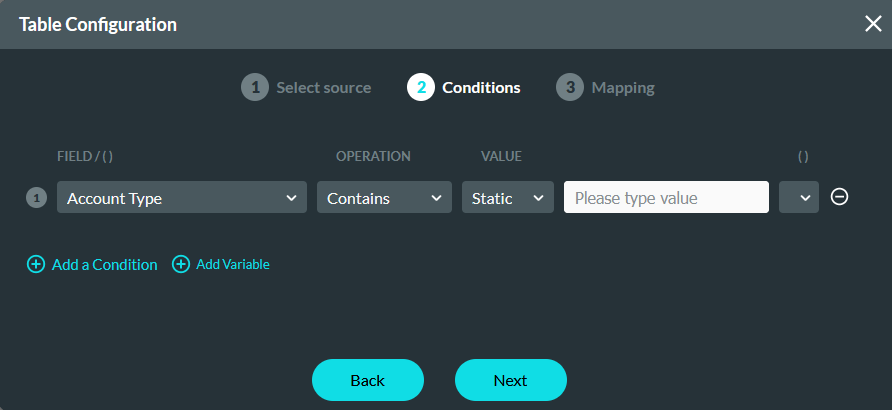
In Step 2, you can set conditions to only pull records that meet criteria. For example, if you only want to return records of a specific account type. In this tutorial, we did not use any conditions for our table.
In Step 3, You can create columns for your tables. This can include actions which can be displayed with a button or icon. You can choose to configure the logic for you action when inserting your table, or come back to this screen and configure it at a later stage.
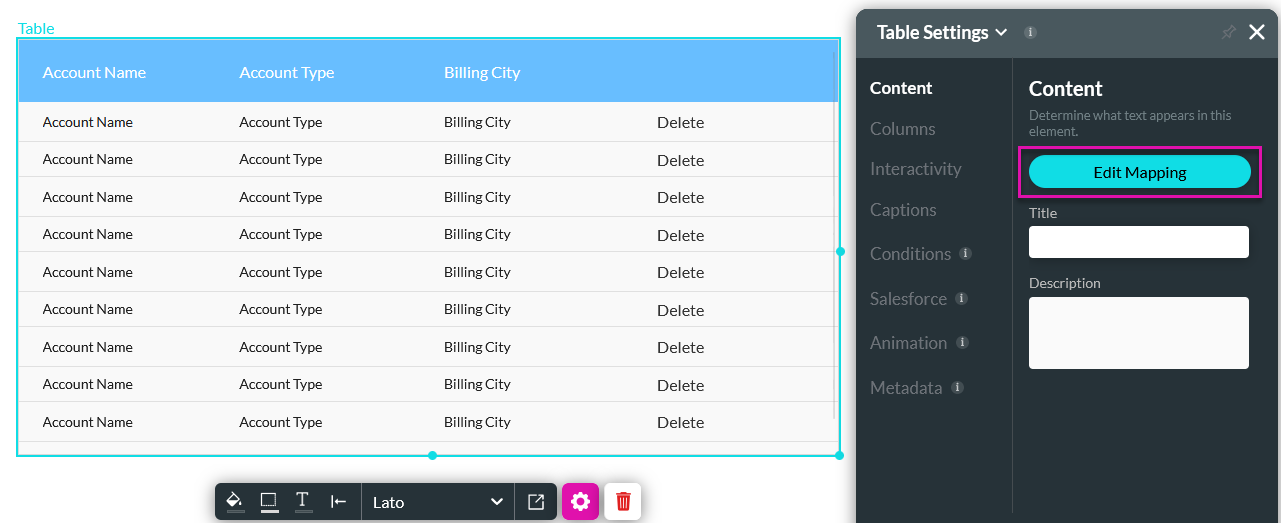
To navigate back to the Table Configuration window, click the Edit Mapping button in the Table Settings menu.
04 Column Settings
To make changes to the columns, select the columns tab, and select the corresponding gear icon.
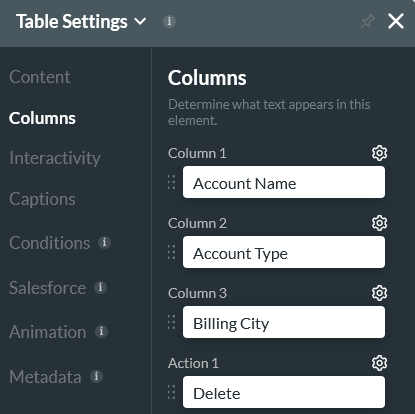
In the columns settings window, there are a variety of settings you can apply.
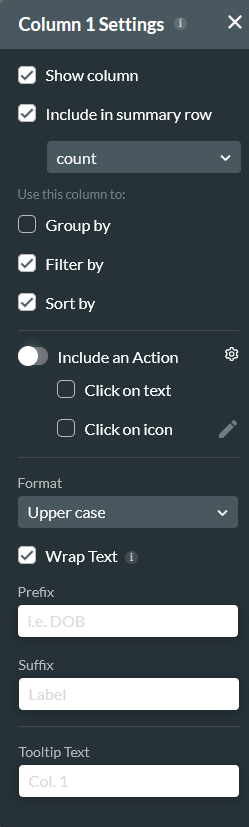
- Show Column can be deselected to hide a column from end users without having to delete the column from your table.
- Include in Summary Row will add a summary row to your table. You can choose the summary amount that displays for example the total count.
- Group by, Filter by, and Sort by adds grouping, filtering, and sorting features to your column.
- Format allows you to choose the formatting of your column content.
- Wrap text option enabled means that long values with be displayed in multiple rows within a column and Wrap text disabled means long values will be displayed cut at the end of the one row.
- Prefix and Suffix allow you to easily add labels to your column data.
- Tooltip Text will display text to end users when they hover.
05 Table Actions
When configuring your table mapping, you can create actions that can make changes to your Salesforce data. For example - users can delete an account from Salesforce.
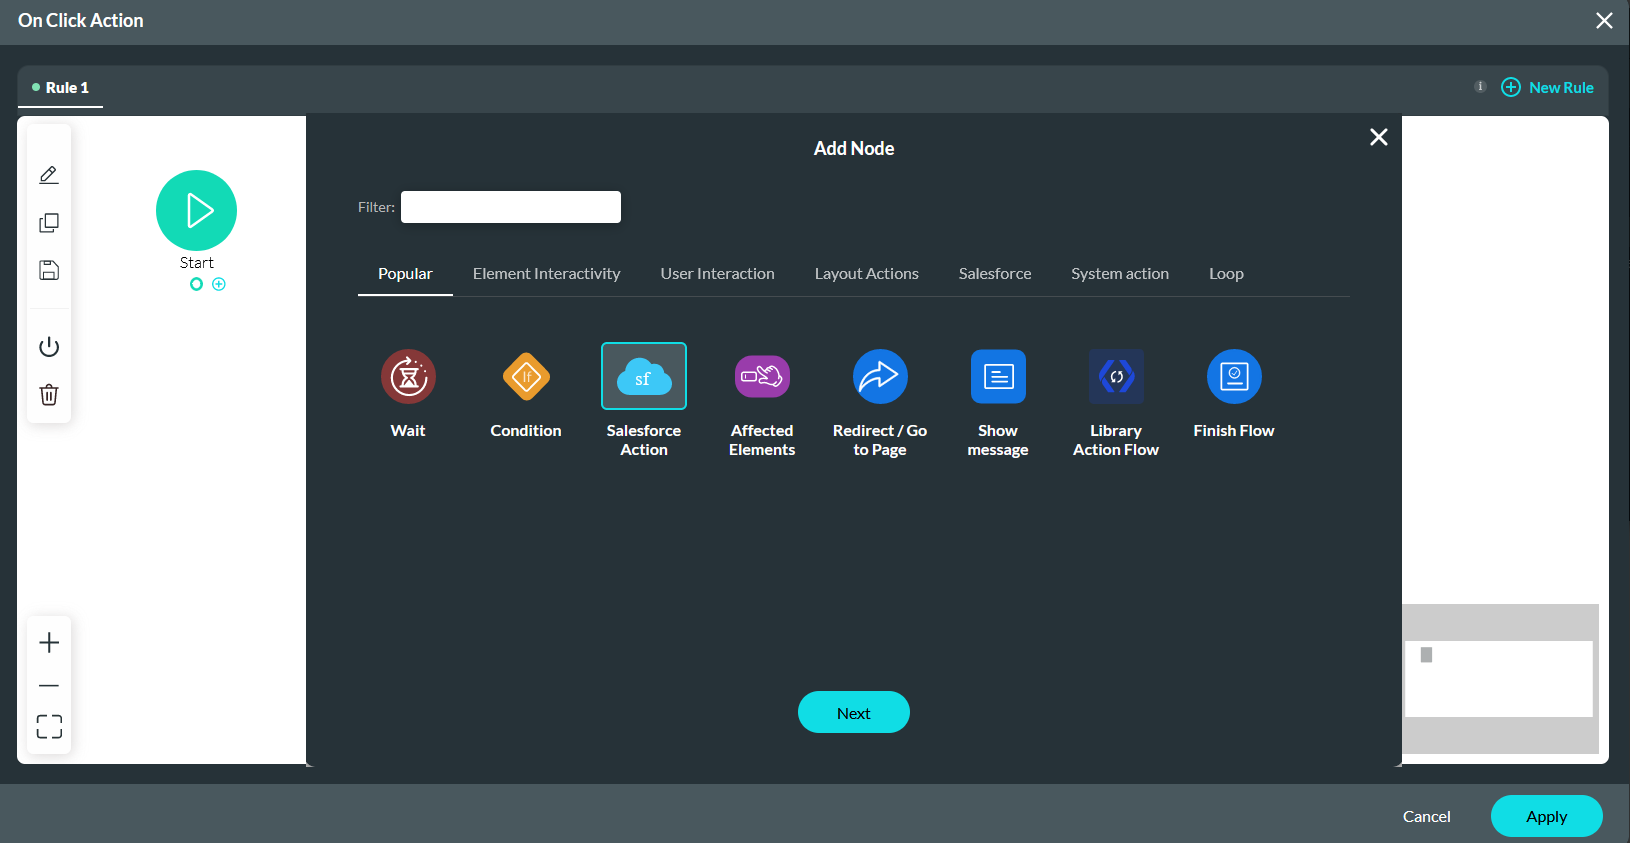
1. Select the On Click Action button to open the configuration window.

2. Select the Start + icon, choose Salesforce Action as the node, and click Next.
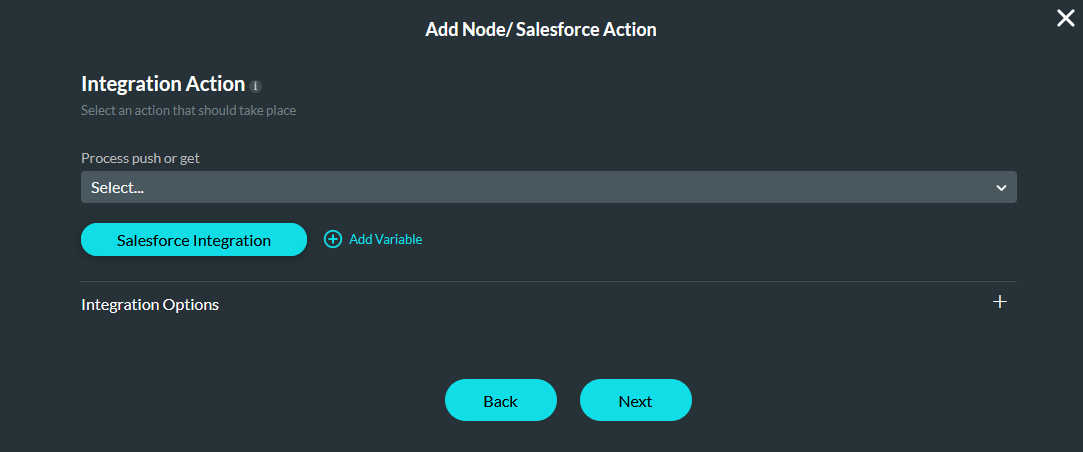
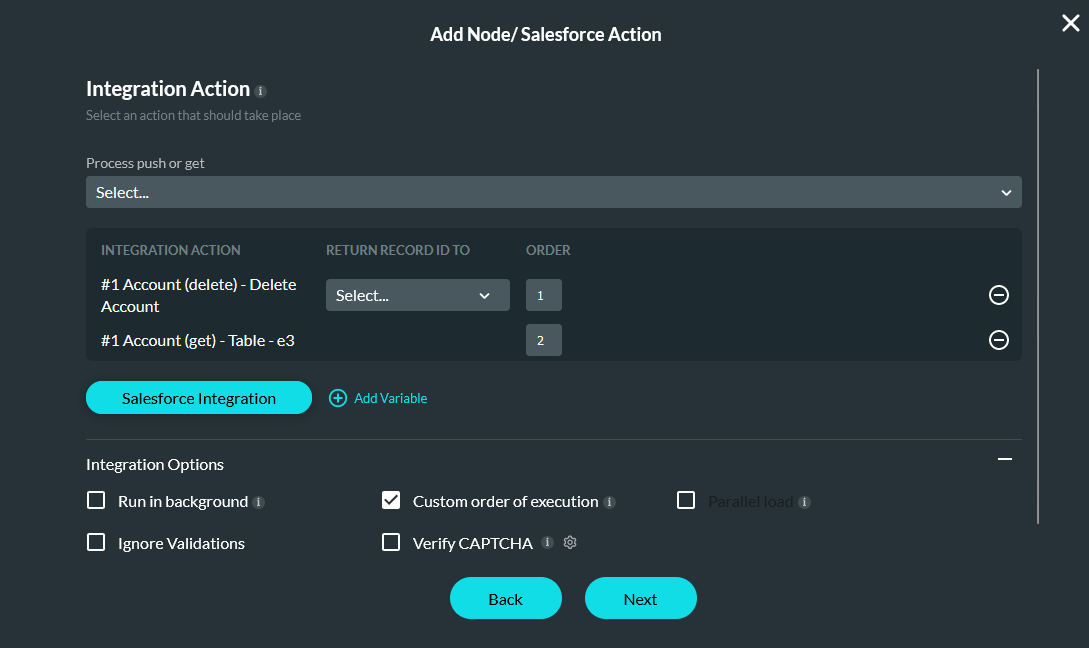
3. Click the Salesforce Integration button.
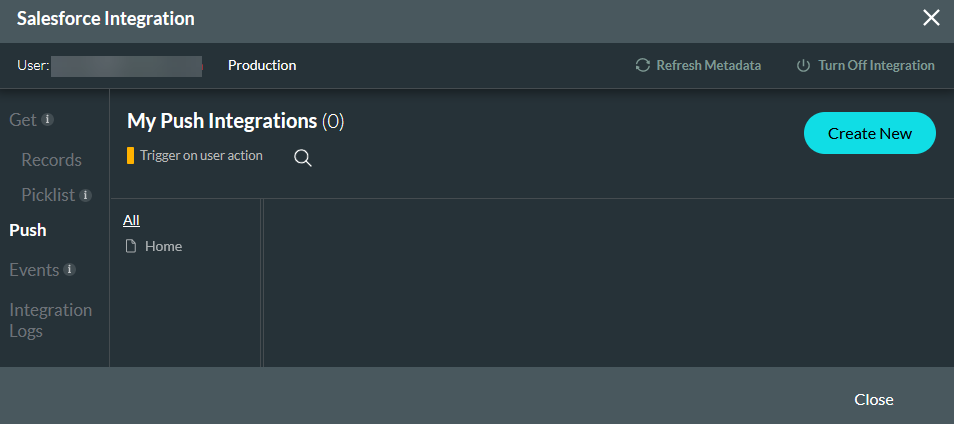
4. In the Push tab, click Create New.
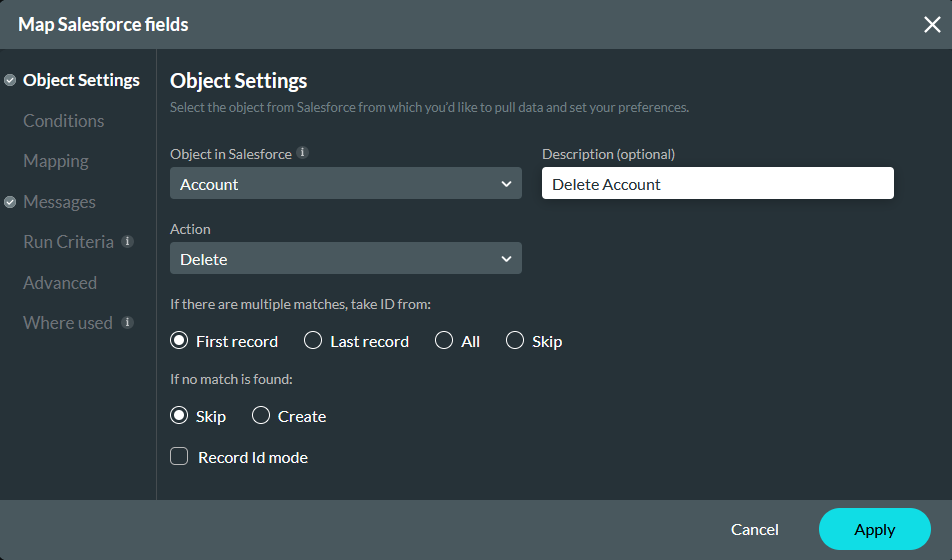
5. In the Object Settings tab, configure: Account as the Object, Delete as the Action, and Delete Account as the description.
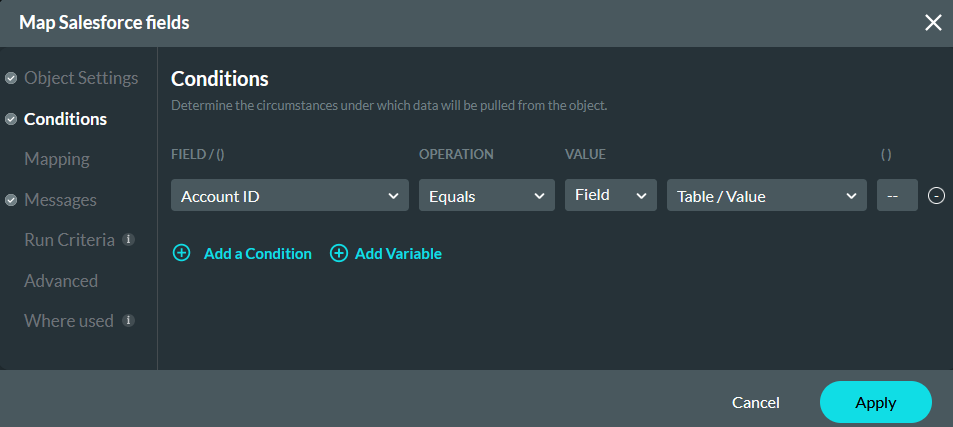
6. In the Conditions tab, configure: Account ID equals the Table Value. Click Apply.
7. Use the dropdowns to select the Delete Account Push and the Table Get.
8. Expand the Integration Options dropdown and enable Custom Order of Execution.
9. Number the Delete Account Push 1 and the Table Get 2. When the user deletes an account, the table will automatically refresh. Click Next.
10. Enter a Tag name and click Insert.
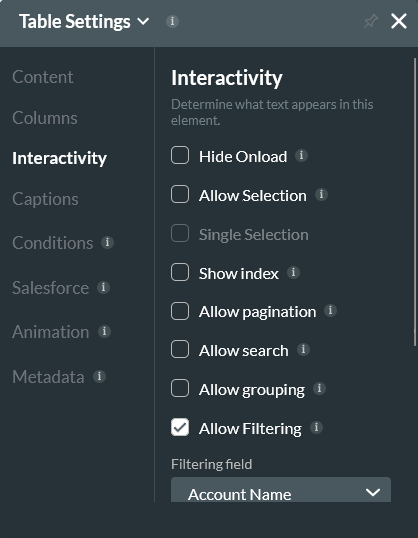
06 Table Interactivity
Using the Interactivity Tab you can control how users can interact with your table element. For example, whether or not the table displays when it loads, allow users to make selections, or include a search field.